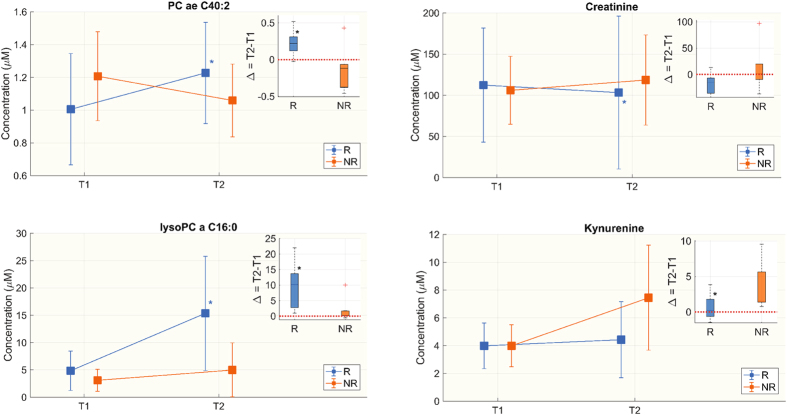
Figure 4.
Targeted metabolomics. Metabolites whose concentration (μM) from T1 to T2 in the two groups is statistically different. The figure shows only 4 metabolites as an example of those differing overtime (see Table 5). Box-plots in the top right corner show the differences in metabolite concentrations between T1 and T2, expressed as delta (Δ = T2 − T1). We did the Wilcoxon rank-sum test for the delta of the two groups and Wilcoxon signed rank between T1 and T2 in each group separately. Significant differences are marked with *(p-value < 0.05).

