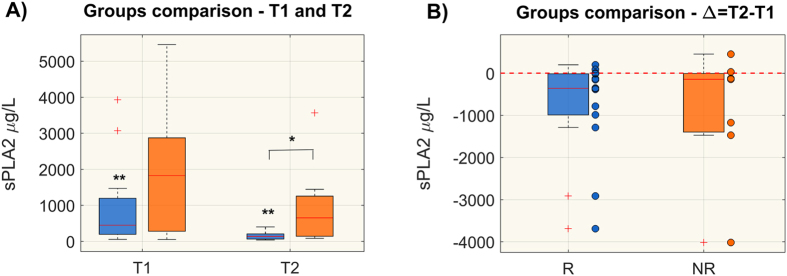
Figure 7.
Plasma sPLA2-IIA levels (μg/L) in responsive (R) and non-responsive (NR) patients at T1 and T2 (panel A) and comparison of time trend variation, expressed as delta (Δ = T2 − T1), between the two groups (panel B). Distributions are shown as box-plots where the central line is the median concentration, the edges of the box are the 25th and 75th percentiles and the outliers are defined as 1.5 times the interquartile range and highlighted by +. Significant differences between groups are marked with *(Wilcoxon rank-sum test p-value < 0.05), whereas significant differences from T1 to T2 are marked with **(Wilcoxon sign-rank test p-value < 0.05).

