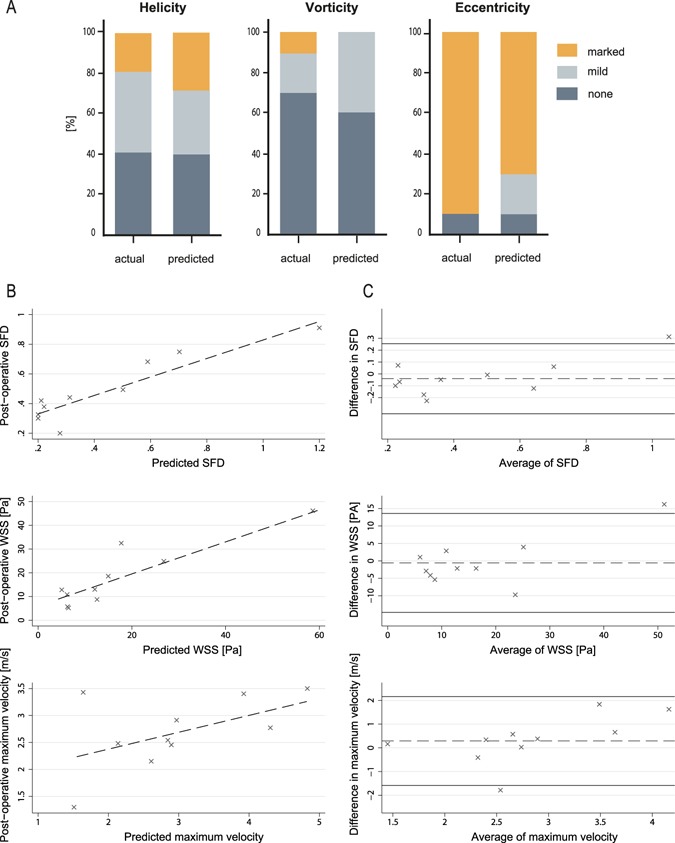
Figure 5.

Comparison between predicted and post-operative haemodynamic outcome. (A) Comparison of blood flow profiles (helicity, vorticity, eccentricity, secondary flow degree) between the model-based prediction (CFD) and the post-operative flow profiles (4D Flow MRI) after a surgical procedure are compared. (B) Linear regression plots of predicted and post-operative secondary flow degree, surface averaged wall shear stress and maximal flow velocity across the valve. (C) Bland-Altman plots of predicted and post-operative secondary flow degree, surface averaged wall shear stress and maximal flow velocity across the valve, plotted against the mean. The continuous horizontal lines illustrate mean −1.96 and +1.96 standard deviations.
