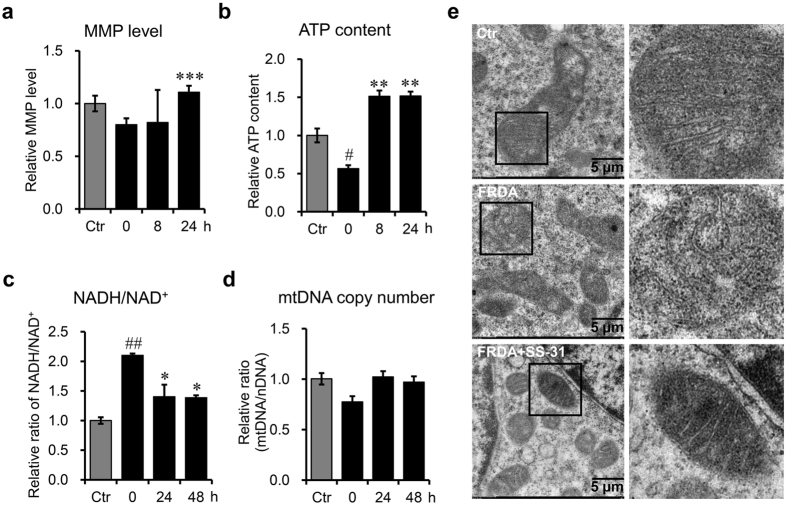
Figure 2.
SS-31 improves the quality and quantity of mitochondria in GM15850 cells after SS-31 treatment. (a) Mitochondrial membrane potential (MMP), examined with a fluorescent probe JC-1. (b) ATP content. (c) Ratio of NADH/NAD+. (d) Relative copy number of mitochondrial DNA (mtDNA) normalised to nuclear DNA (nDNA). CytB represents mtDNA genome; β-actin represents nuclear genome. Values represent mean ± SEM (n = 4, each duplicates). (e) Mitochondrial morphology revealed by electron transmission microscopy. Ctr: GM15849; FRDA: GM15850; FRDA+SS-31: GM15850 cells treated with SS-31 for 24 h. Values represent mean ± SEM (n = 3, each duplicates). A one-way ANOVA was carried out, # p < 0.05, compared with Ctr. *p < 0.05, **p < 0.01, ***p < 0.001, compared with the untreated GM15850 cells.

