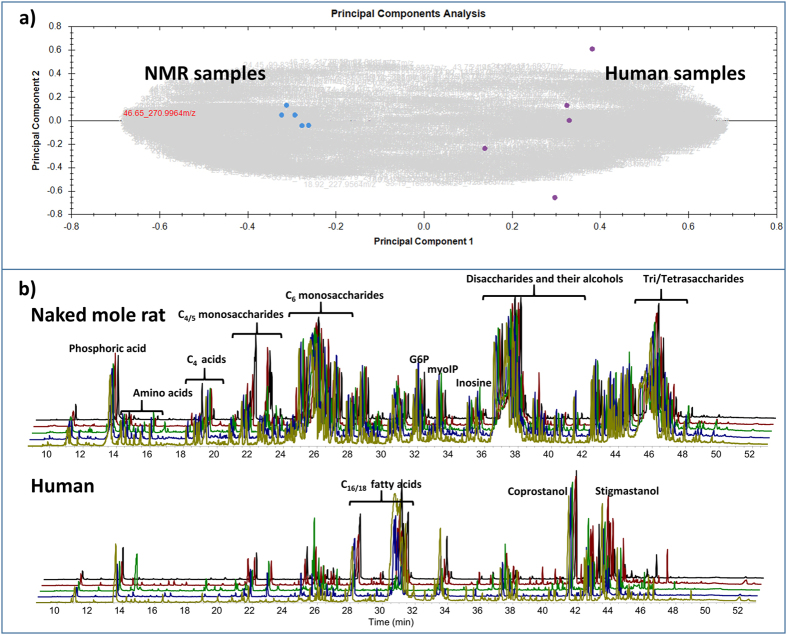
Figure 4.
Polar metabolites in feces of the naked mole-rat. (a) Principal components analysis of GC-MS analysis of polar metabolites from the feces of naked mole-rat (NMR) and human samples (n = 5 each). The more distant the samples are in this graphic, the more their compound pattern differs. Naked mole-rat and human samples are separated on the level of principal component 1 which represents 58% of the variance; principle component 2 (10% variance) represents the variance within the replicates of one group. Clearly, naked mole-rat samples are far more distant to human samples than to each other. (b) Total ion current of GC-MS analyses of polar metabolites from the feces samples of naked mole-rat and human (n = 5 each). Top: Naked mole-rat replicates; Bottom: human sample replicates. Compound groups are labeled using brackets.

