Figure 2.
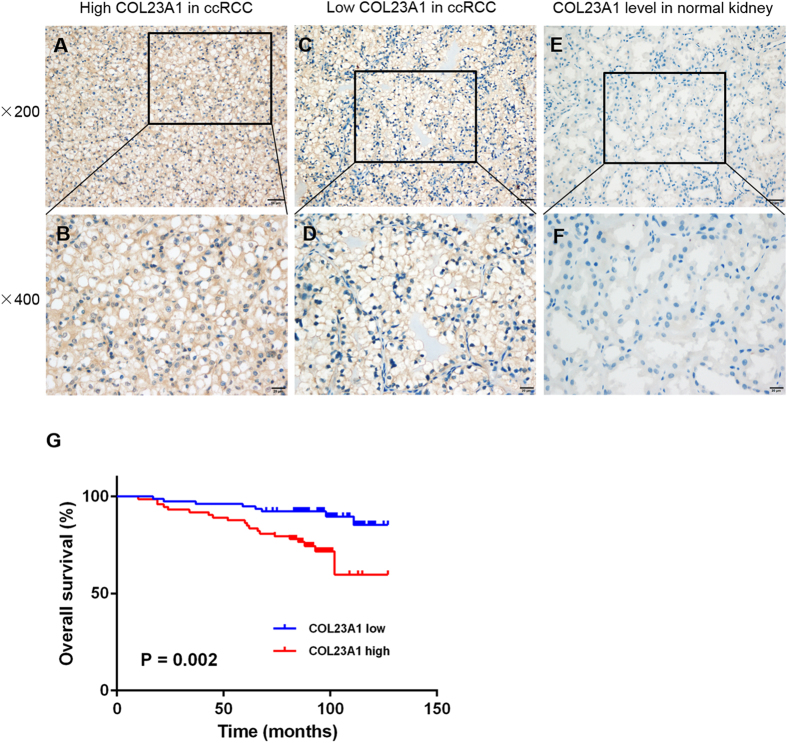
The correlation between COL23A1 expression and prognosis in ccRCC. (A,B) Representative high COL23A1 level in ccRCC tissues with (A) ×200 magnification and (B) ×400 magnification. (C,D) Representative low COL23A1 level in ccRCC tissues with (C) ×200 magnification and (D) ×400 magnification. (E,F) Representative COL23A1 level in normal kidney tissues with (E) ×200 magnification and (F) ×400 magnification. (G) Kaplan-Meier curves for OS after radical nephrectomy.

