Fig. 3.
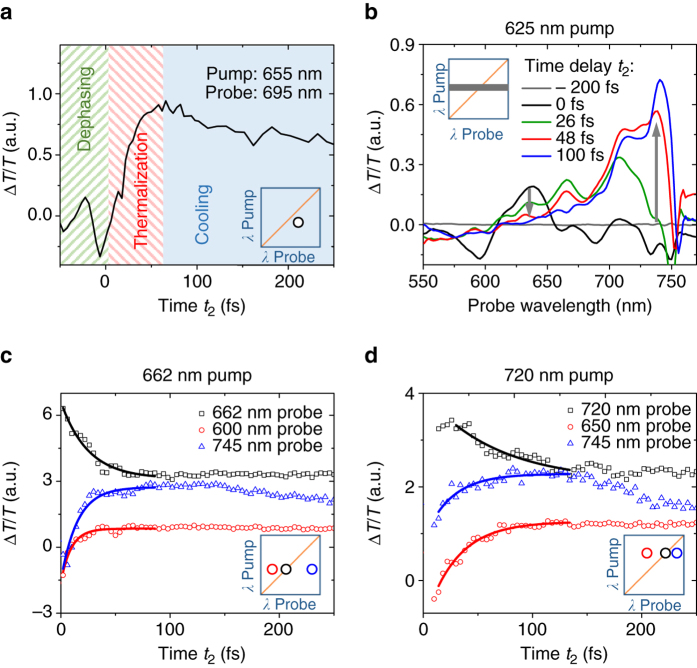
Carrier thermalization in perovskites. a 2D electronic spectroscopy (2DES) kinetic at 655 nm pump and 695 nm probe wavelength, which is on the right side of the 2DES map diagonal and thus between the pump wavelength and the bandgap (excitation density: 2 × 1018 cm−3). We observe three different regimes: a coherent regime at negative times during which we observe spectral oscillations, a thermalization regime during which we observe a rise in signal much slower than the temporal width of the instrument response function and delayed relative to the rise of the diagonal, and a carrier cooling regime during which the signal slowly decays. b ΔT/T spectra for 625 nm pump wavelength extracted from 2DES maps for different time delays t 2 at an excitation density of 2 × 1018 cm−3. Initially, we observe a peak around the pump energy. Carriers quickly thermalize and form a Boltzmann distribution. c, d Kinetics of carrier thermalization for c 662 nm and d 720 nm pump wavelength at an excitation density of 2 × 1019 cm−3. While the diagonal signal decays, the off-diagonal signals rise indicating that carriers scatter from the initial sharp energy distribution into a broad statistic energy distribution. The lines represent a mono-exponential fit to the experimental data

