
Fig. 2.
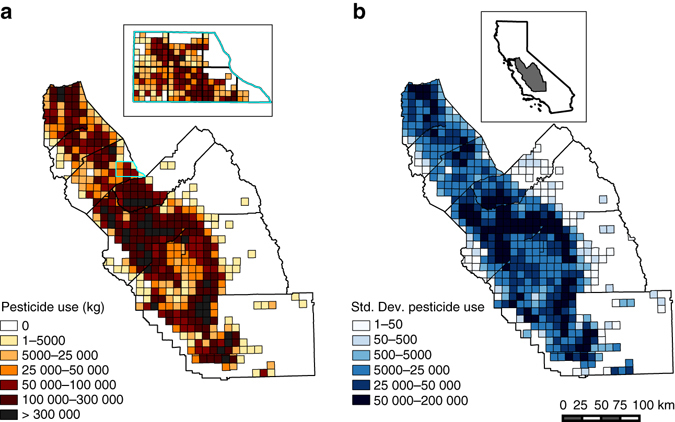
Spatial distribution of pesticide use and variability in California’s San Joaquin Valley. The total kg of annual pesticide active ingredients varies over space and time as illustrated by the distribution of total kg by ~93 km2 PLS Township in 2011 a, and the standard deviation of total kg by PLS Township b. The inlay on the left shows pesticide use at the 2.6 km2 PLS Section, the unit of pesticide observation. The color scheme for the inlay corresponds to that of the PLS Township legend, adjusted for the difference in area (i.e., the most exposed category for the PLS Section is >8333 kg, 1/36th the values for the corresponding PLS Township category). The inlay on the right illustrates the study region within California. The scale bar corresponds to 100 km for the main panels