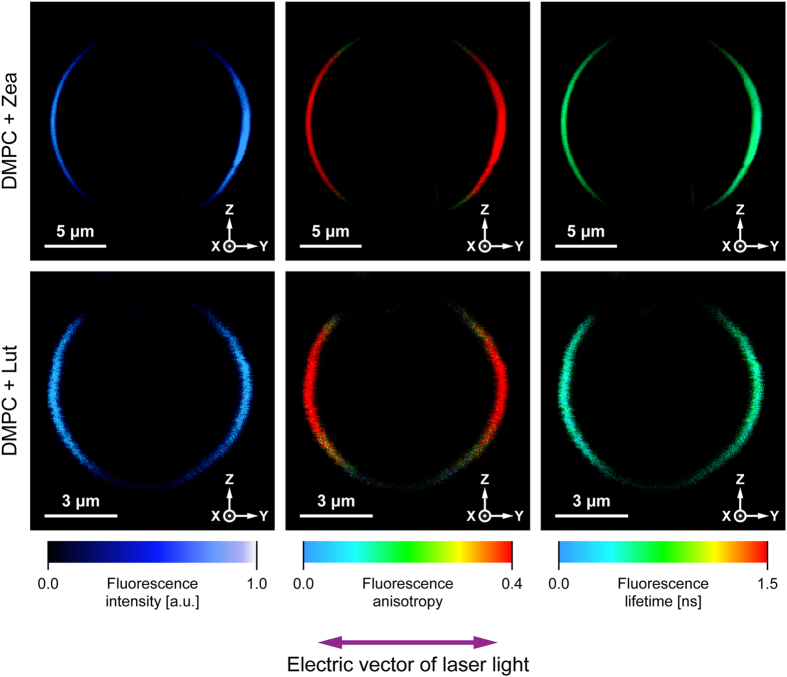
Figure 2.
The results of microscopic imaging of single lipid vesicles containing xanthophylls incorporated to the lipid phase. Three panels show fluorescence intensity, anisotropy and lifetime. The images represent an equatorial vesicle cross-section in the focal plane of a microscope. The upper panel presents a liposome containing incorporated zeaxanthin, the lower panel presents a liposome containing incorporated lutein. The direction of the electric vector of probing light is shown below the images (collinear with the Y axis).

