Figure 1.
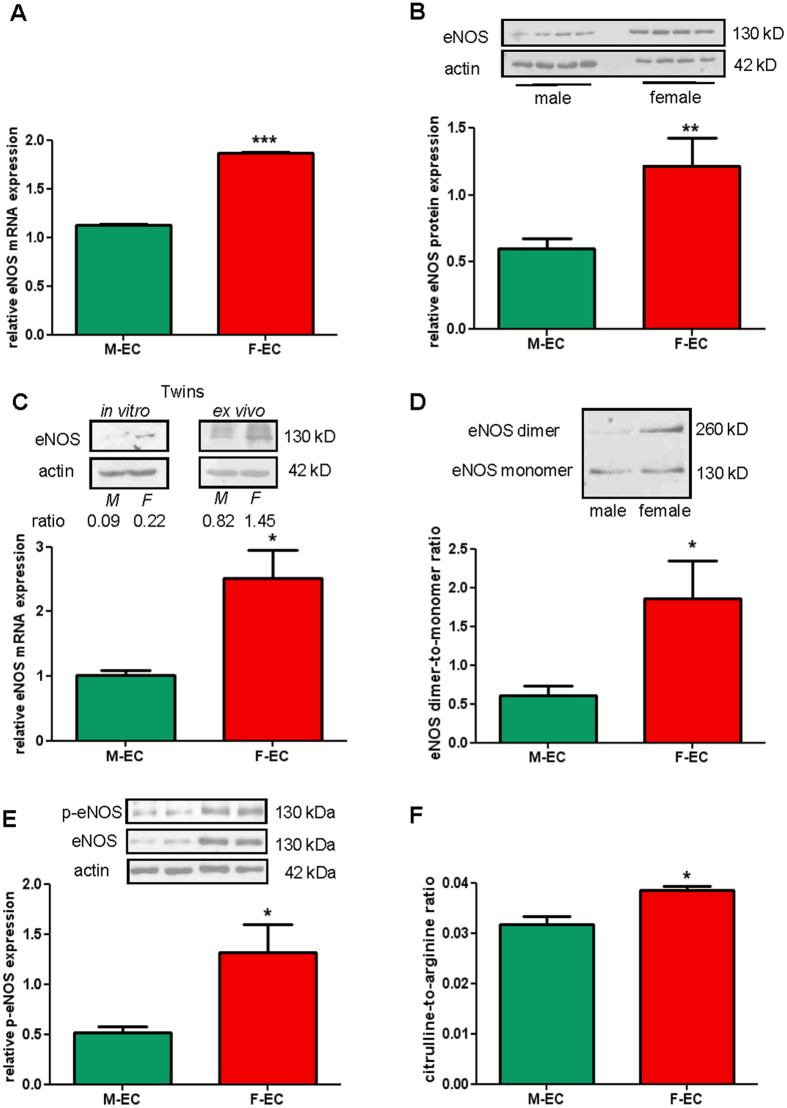
eNOS expression and activation are higher in F- than in M-ECs. (A) eNOS RNA was measured by RT-qPCR and normalized to the housekeeping gene 18 S. ***p < 0.001, n = 3. (B) Total eNOS protein was evaluated by immunoblotting on male and female lysates. β-actin was used as a loading control. A representative blot (showing 4 independent male and female lysates, 10 µg/lane) and the densitometric analysis of eNOS protein expression normalized to β-actin are shown. **p < 0.01; n = 14. (C) Upper panel, eNOS protein evaluated on lysates from twin male and female ECs at P1 passage (in vitro, left panel) or collected immediately after the flushing from cords (ex vivo, right panel). Representative blots out of two are shown. Lower panel, eNOS RNA measured by RT-qPCR on total RNA extracted from twin M- and F-ECs at P1 in vitro passage. Data are normalized to the housekeeping gene ACTB. *p < 0.05; n = 3. (D) eNOS dimers and monomers were separated by LT-PAGE as described in the Methods section. A representative blot and the densitometric analysis of the dimers-to-monomers ratio are shown. *p < 0.05; n = 6. (E) A representative blot (showing 2 independent male and female lysates, 20 µg/lane) and the densitometric analysis of phospho-eNOSSer1177 (p-eNOS) protein expression normalized to β-actin are shown. *p < 0.05; n = 5. (F) LC-MS analysis was performed on M- and F-EC samples prepared and analyzed as described in the Methods section. Data are expressed as the citrulline-to-arginine ratio. *p < 0.05; n = 3.M- and F-ECs are green and red, respectively.

