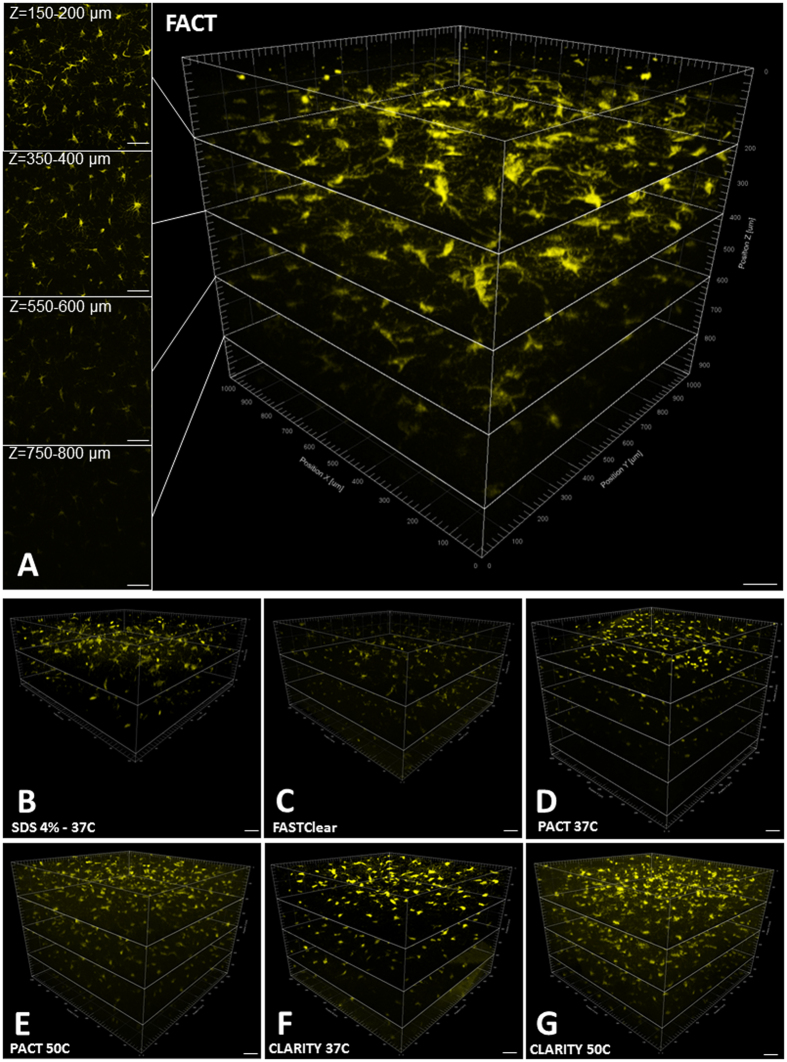
Figure 3.
High-resolution imaging of microglia expressing YFP in the cerebral cortex after clearance with seven protocols. Confocal microscopy was employed at 25× magnification with an area of 1024 × 1024 μm2 and at different depths. (A) The XYZ acquisition of FACT-cleared cortex detected microglia to a depth of 948 μm (each section in Z is 200 μm). The left panels represent the maximum-intensity projections over a 50-µm-thick volume at different depths. (B–G) The other clearing protocols with different depths of microglia signal detection: SDS4%-37 °C, 442 μm; FASTClear, 561 μm; PACT-37 °C, 884 μm; PACT-50 °C, 783 μm; CLARITY-37 °C, 753 μm; and CLARITY-50 °C, 753 μm. Scale bars are 100 μm.

