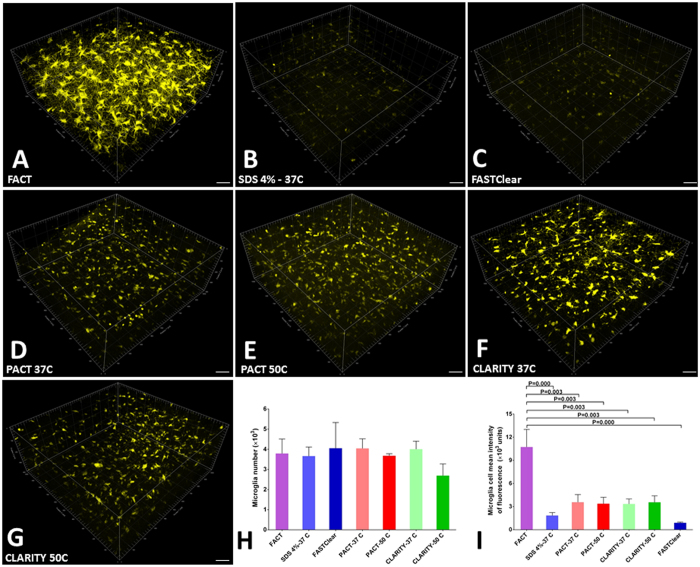
Figure 4.
Comparisons of 400-µm-thick volumes of Z-stack images of microglia after testing seven protocols. (A–G) Three-dimensional blocks of microglia populations of the cerebral cortex in transgenic mice after clearing with the various protocols. The greatest signal and maximal architectural details were achieved with the FACT protocol. For all images, confocal microscopy was employed at 25× magnification. (H) Comparisons of corrected microglia numbers between the different clearing protocols (after semiautomatic counting with the Imaris Surface algorithm) reveal a lack of significant differences between the groups (p > 0.05). (I) Comparisons of the corrected mean intensities of the signals between the different protocols. The highest signal detection was achieved with the FACT protocol. Scale bars are 100 μm.

