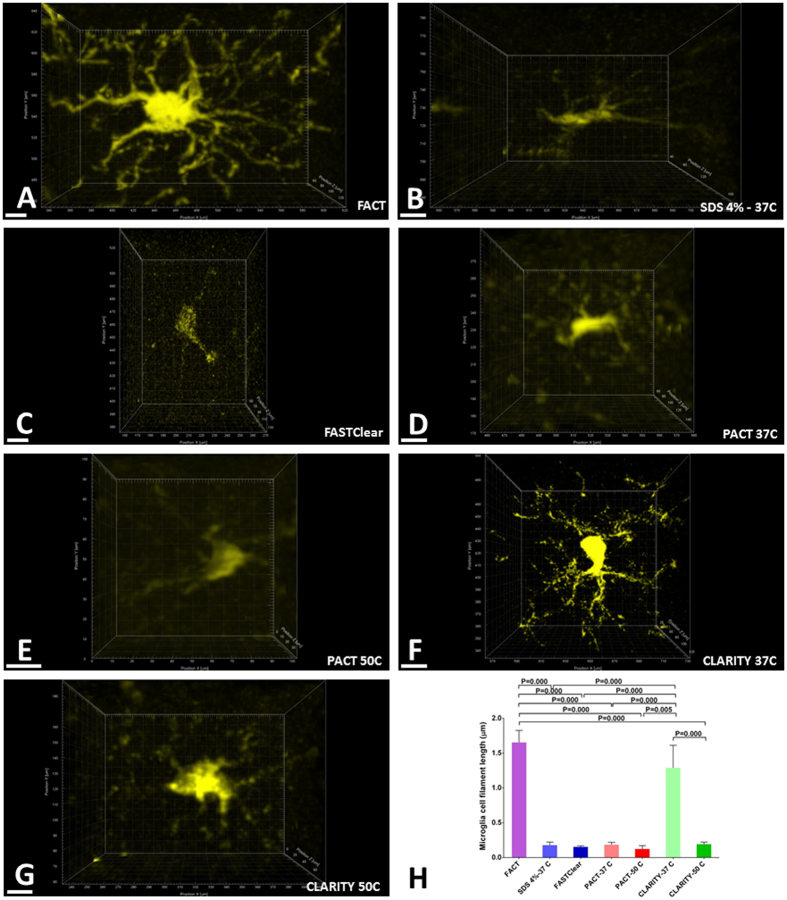
Figure 6.
Comparison of the three-dimensional structures of individual microglia. (A–G) Selected microglia from the topmost scanned layers (Z = 0–50 μm) of each XYZ acquisition from the different clearing protocols. The finest and most visibly continuous branches are achieved with the FACT protocol. (H) Comparisons of microglial branch length among the seven clearing protocols using the semiautomatic Imaris Filament algorithm. The highest signals were detected with the FACT and CLARITY - 37 °C protocols. All confocal images were captured at 25× magnification. Scale bars are 20 μm.

