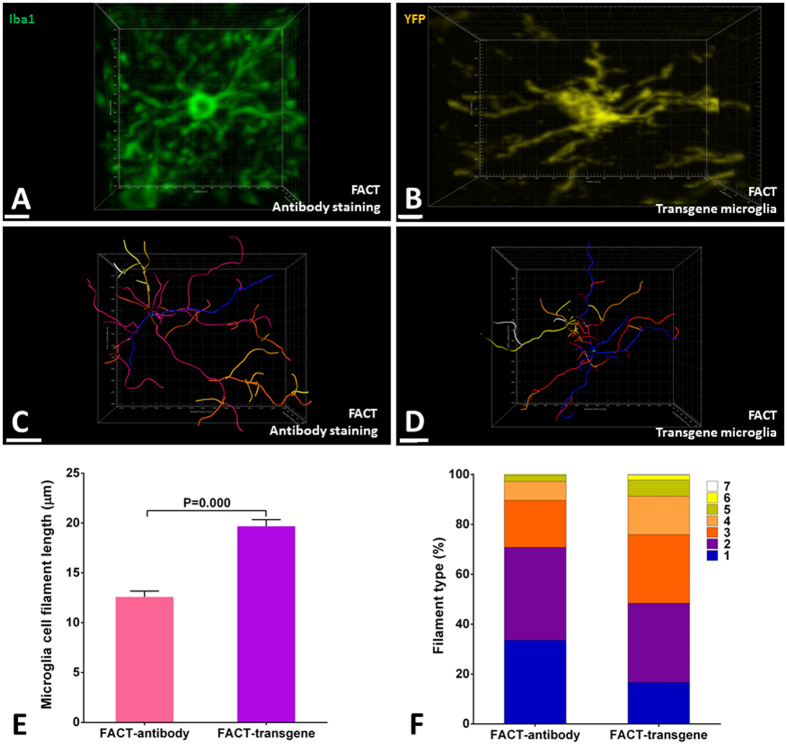
Figure 9.
3D structure of individual microglia to compare the sensitivity of the FACT protocol for antibody-stained microglia versus transgene-labeled microglia. (A and B) Selected microglia from the topmost scanned layers (Z = 0–50 μm) of each XYZ acquisition show fine and continuous branches with both antibody and transgene-YFP signals. (C and D) Different colors represent different levels of microglia branches reconstructed by the Imaris Filament algorithm and color-sorted by Imaris Vantage from blue (the first level) to white (the last level). Selected microglia from the topmost scanned layers (Z = 0–50 μm) of each XYZ acquisition, representing the maximum types of reconstructed filament levels in the FACT protocol with antibody or transgene-YFP labeling. All confocal images were captured at 25× magnification. (E) Comparisons of microglial branch length between the two labeling protocols using the semiautomatic Imaris Filament algorithm. Longer branches were observed in the transgene-YFP microglia compared to antibody labeling due to differences in tissue compaction in the two methods. (F) Comparisons of the proportions of 3D reconstructed filament levels. No significant difference was seen between the labeling protocols (p > 0.05).Scale bars are 20 μm.

