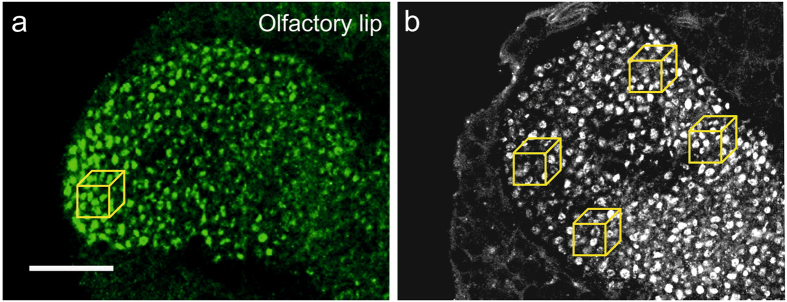
Figure 1.
Comparison between confocal microscopy scans from two different studies. Synapsin immunolabeling of the brain of a 20-day old (a) and a 35-day old (b) honeybee worker, Apis mellifera. (a,b) Single frontal confocal section of the olfactory lip region showing the distribution of anti-synapsin labeled boutons. Each yellow box indicates a volume of 10 µm × 10 µm × 10 µm. (a) Detail view from Fig. 5D from Peng and Yang17 (the yellow box was added). (b) Detail view from Fig. 1b from Groh et al.10. In both cases the lip regions contain synapsin-positive boutons of similar size, distribution and density. However, automated counting in Peng and Yang17, on average, revealed 1.9 boutons per 1,000 µm3, whereas visually guided counts by Groh et al.10 quantified 32.9 MG per 1,000 µm3. Scale bar: A: 25 µm (also applies to B).

