Figure 1.
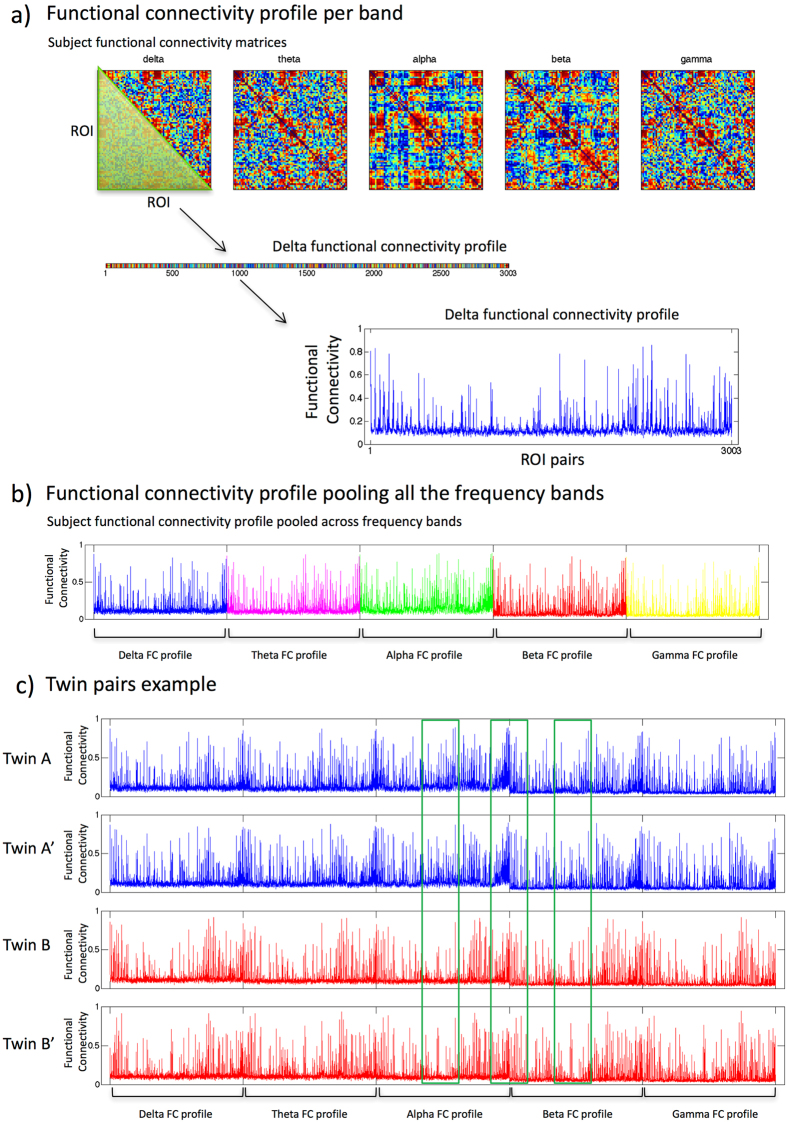
Example of functional connectivity fingerprints. For every subject, and for every frequency band, a FC matrix was computed using a FC measure (a). Every matrix contains ranked values for visualization purposes. From every FC matrix the lower triangular entries, consisting of the pair-wise connectivity between all possible combinations of ROIs (i.e. ), were extracted. These entries correspond to the FCF for a frequency band. An example of a FCF in the delta band is shown in the bottom plot in (a) where the y-axis shows FC values and the x-axis are the ROI pairs. A FCF was computed for every frequency band and these were pooled together (delta FCF in blue, theta FCF in magenta, alpha FCF in green, beta FCF in red and gamma FCF profile in yellow) to obtain a single global FCF (b), which was used for the identification analysis. An example of global FCFs for two different twin pairs ((A-A′) and (B-B′)) is shown in (c). Visual comparison of the FCFs suggest that within a twin pair FCFs are more similar than between unrelated subjects (see green ellipsoids in (c)). The same strategy was used to obtain ECFs.

