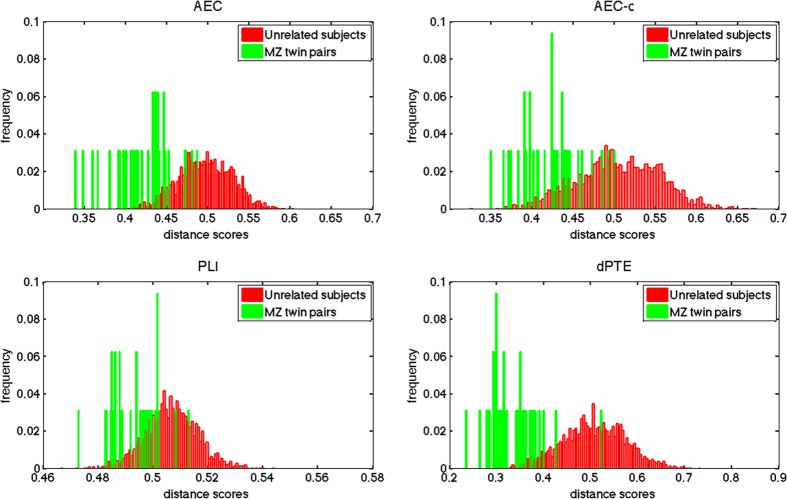
Figure 2.
Distance score histograms for MZ twin pairs and for genetically unrelated subjects. For every connectivity measure (AEC, AEC-c, PLI and dPTE) the distance score distributions are displayed. These distance scores were computed using the global FCFs or ECFs after the removal of the shared pattern. Note the differences in scales for the x-axes. Also note that score distributions obtained with dPTE were further apart compared to the distributions obtained when using other connectivity metrics.

