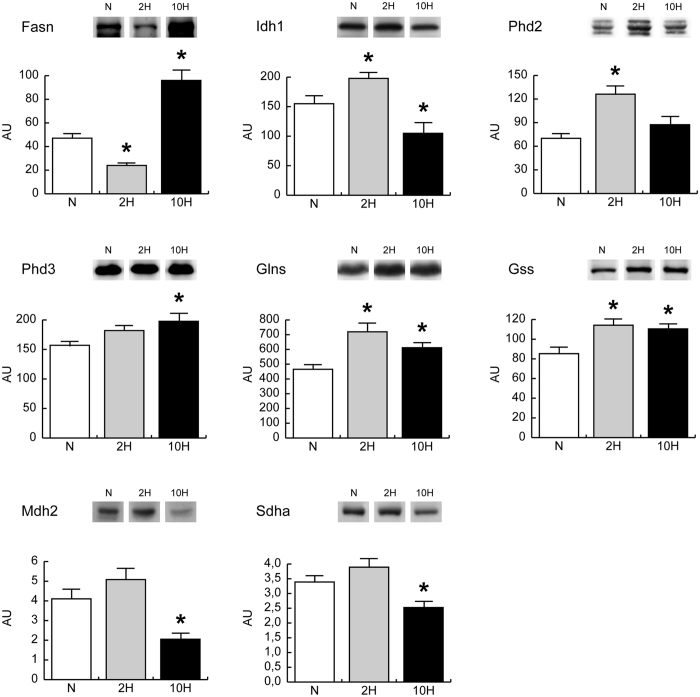
Figure 4.
Expression levels of key metabolic enzymes in skeletal muscle of mice exposed to 2-day (2 H) and 10-day (10 H) hypoxia. Representative immunoblot images (cropped images; full lenght blots are included as Supplementary Data) and histograms of protein expression levels of fatty acid synthase (Fasn), isocitrate dehydrogenase 1 (Idh1), glutamine synthetase (Glns), glutathione synthetase (Gss), HIF prolyl hydroxylase 2 and 3 (Phd2 and Phd3), mitochondrial malate dehydrogenase (Mdh2) and succinate dehydrogenase A chain (Sdha) in 2 H and 10 H compared to normoxic controls (N). Data were normalized against the total amount of loaded proteins stained with Sypro Ruby. Statistical analysis was performed by ANOVA and Tukey test (n = 5, p < 0.05). *Significant difference between 2 H and 10 H versus N.

