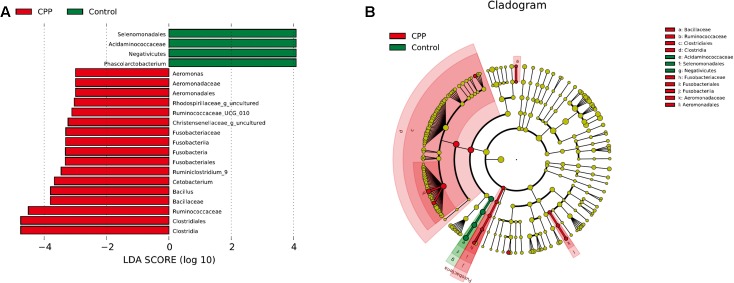
FIGURE 4.
Linear Discriminant Analysis (LDA) shows distinct gut microbiome composition in the METH CPP group and the control group. (A) LDA scores, as calculated by the LEfSe of taxa differentially abundant in the two groups. (B) LEfSe cladogram representing differentially abundant taxa. Only taxa with LDA scores of more than 2 are presented.

