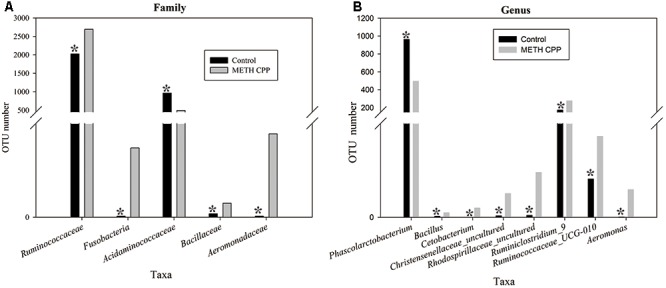
FIGURE 5.

Taxonomic differences of fecal microbiota between the control and METH CPP groups. Comparison of relative abundance at the bacterial family (A) and genus (B) levels between these two groups. Student’s t-test was used to determine whether differences existed between the two groups. ∗p < 0.05.
