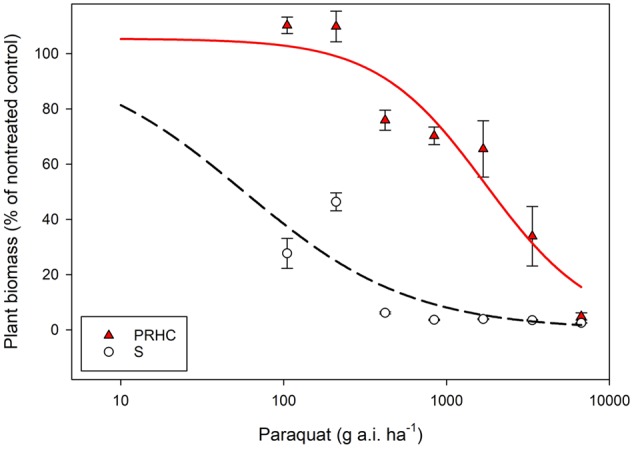
FIGURE 1.

Dose-response analysis of paraquat-resistant (PRHC) and -susceptible (S) Lolium perenne L. spp. multiflorum. Data points represent plant biomass of PRHC (solid, red triangles) and S (open, black circles) 28 days after paraquat treatment compared to a non-treated control. Bars on data points represent standard errors (N = 8). Lines represent three-parameters log-logistic regression of PRHC (red, solid lines) and S (black, dashed lines). Y = d /1 + exp [b (log x - log e)]}, where b denotes the relative slope around e, d is the upper limit, and e is the amount of paraquat required to reduce biomass by 50% (in g a.i. ha-1).
