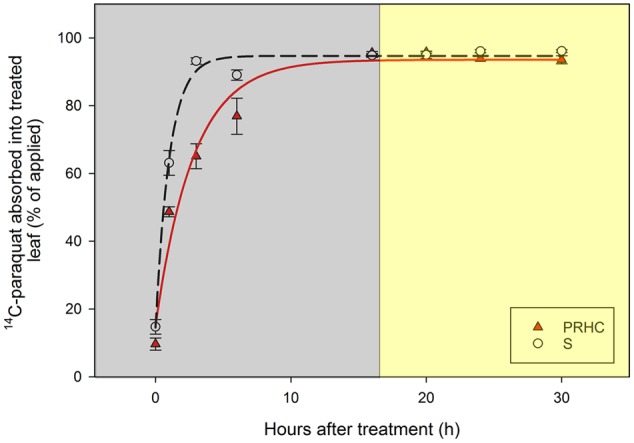
FIGURE 2.

Absorption of paraquat into treated leaf of paraquat-resistant (PRHC, solid, red triangles) and -susceptible (S, open, black circles) Lolium perenne L. spp. multiflorum. Data points are means and bars represent standard errors. Lines represent asymptotic regressions of PRHC (solid, red line) and S (dashed, black line) after 0, 1, 3, 6, 16, 20, 24, and 30 h after treatment. Y = (Amax x t) / [(10/𝜃) x t𝜃 + t], where Y is the absorption (as percentage of applied), Amax is the maximum percentage of absorption at large values of t, t is time, and 𝜃 is an arbitrary percentage of t. Dark-shaded area represent timepoints harvested during dark-incubation. Light-shaded area represent timepoints harvested during light-incubation.
