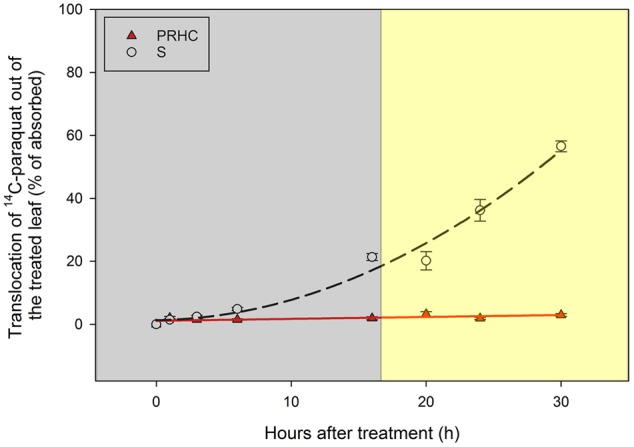
FIGURE 3.

Translocation of 14C-paraquat out of treated leaf in paraquat-resistant (PRHC, solid, red triangles) and -susceptible (S, open, black circles) Lolium perenne L. spp. multiflorum. Data points are means (N = 8) and bars represent standard errors. Lines represent polynomial regressions of PRHC (solid red line, Y = ax + b) and S (dashed black line, Y = ax2 + bx + c) after 0, 1, 3, 6, 16, 20, 24, and 30 h after treatment. Dark-shaded area represent timepoints harvested during dark-incubation. Light-shaded area represent timepoints harvested during light-incubation.
