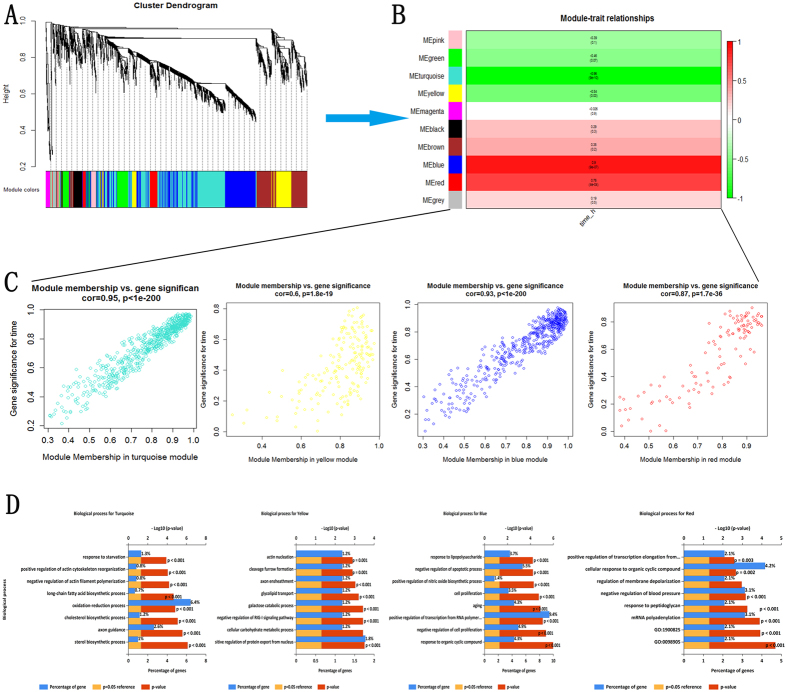
Figure 2.
Four modules that significantly associated with the time point. (A) Gene dendrogram showing the co-expression modules constructed by the WGCNA and labeled by colors; (B) Module-trait associations. Each row contains the corresponding correlation and p-value. And each of them was color-coded by correlation according to the color legend; (C) A scatter plot of gene significance (GS) for time vs. module membership (MM) in the turquoise, yellow, blue and red module. There were highly significant correlations between GS and MM in those modules; (D) Enriched biological processes for those modules.

