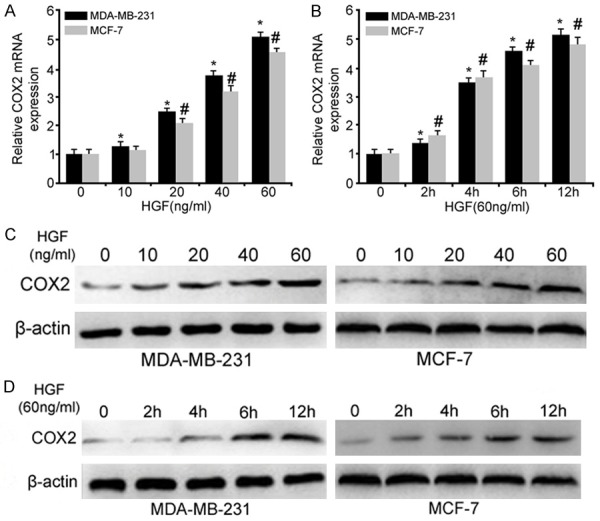
Figure 2.

HGF-induced COX2 expression in breast cancer cells as analyzed by qRT-PCR and Western blot. A: HGF dose-response of COX2 mRNA expression in MDA-MB-231 and MCF-7 cells. Breast cancer cells were grown to 80% confluence and serum-deprived for 24 hours. Cells were then treated with the indicated concentrations, ranging from 10 to 60 ng/ml of HGF for 12 h. B: Time-dependent up-regulation of COX2 in breast cancer cells at the indicated time points. All values were normalized to the expression level of the control group, which was set to 1. C: Western blotting was performed for COX2, and β-actin confirmed equal protein loading. D: Western blot analysis for COX2 following 60 ng/ml HGF treatment for the indicated times in breast cancer cells (*, P<0.05 vs. the MDA-MB-231 control group and #, P<0.05 vs. the MCF-7 control group).
