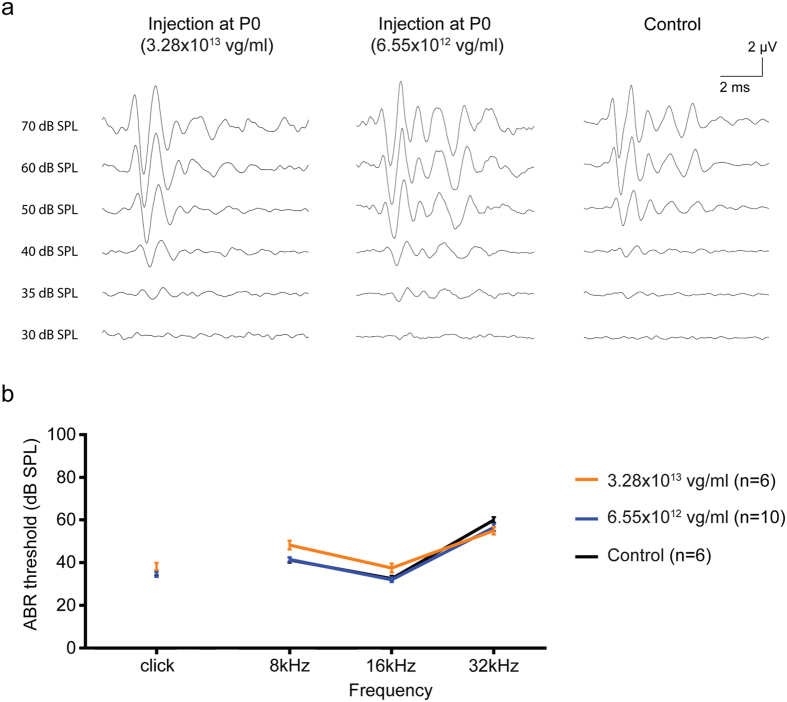
Figure 5.
Comparison of the ABR data from P0–1 injected and control mice. (a) Representative ABR traces recorded from injected (high and low titer) mice 4wks after AAV2/9 inoculation at P0-1 (high and low dose) and the control 4-wk-old mice. Waveforms from injected and control mice appear similar. (b) Click and tone-burst ABRs show relatively normal threshold profiles in the injected mice compared with control mice at 4wks (n, numbers of ears). Slight differences of ABR threshold of less than 10 dB were observed across all frequencies. Data are means ± SEM.

