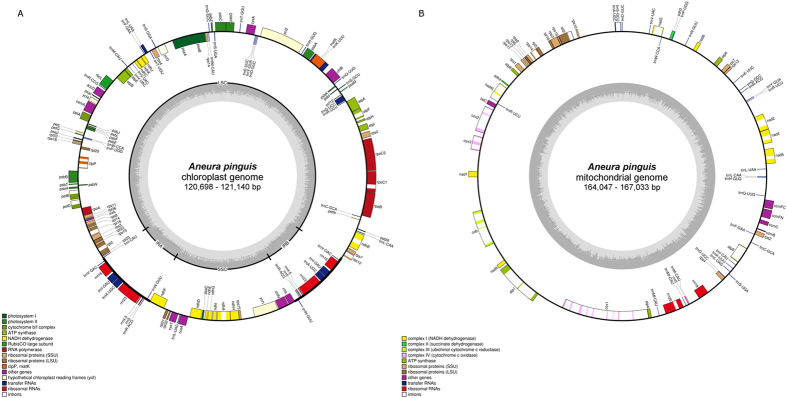
Figure 1.
Genome maps of Aneura pinguis chloroplast (A) and mitochondrial (B) genomes. OGDraw genome maps72. Genes in the clockwise direction are on the inside of the map, and genes in the counterclockwise direction are on the outside of the map. Annotated genes are colored according to the functional categories shown in the legend. The inner circle visualizes GC content with midpoint line which indicates 50% GC content. Histogram presents GC content per 50 bp.

