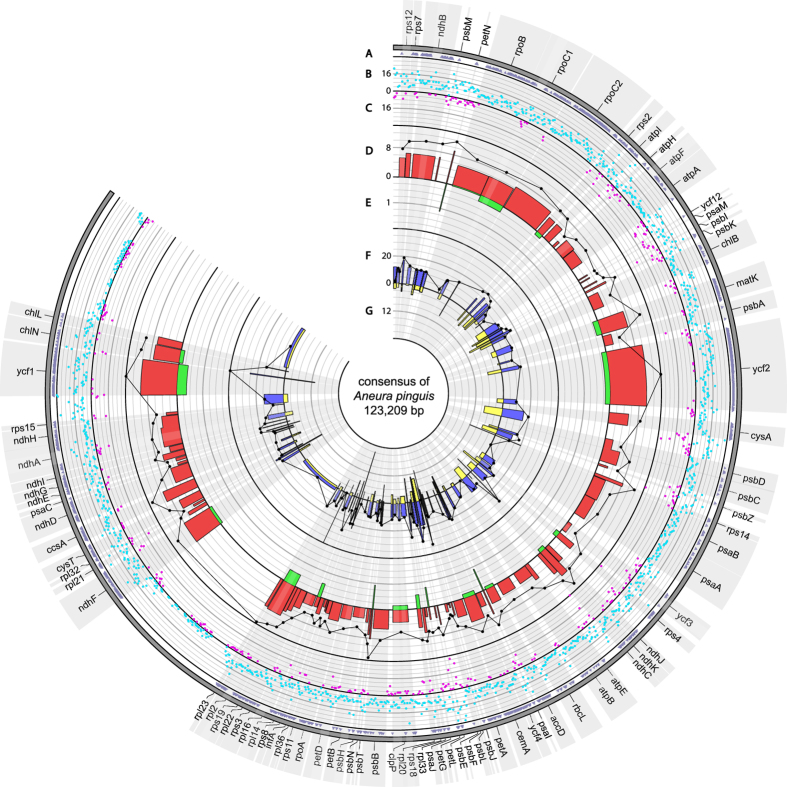
Figure 2.
Circos graph representing SNP and indel variation among plastomes of six cryptic species of A. pinguis. Track A shows nonsynonymous SNP occurence within genes. Track B and C represent identified SNP (light blue spots) and indel (purple spots) per 100 bp, respectively. Track D represents percent of SNPs per CDS length while track E represents percent of indels per CDS length. Black plot represents π value (maximum value = 0.06) for each CDS. Track F represents percent of SNPs per noncoding region length while track G represents percent of indels per noncoding region length. Black plot represents π value (maximum value = 0.2) for each noncoding region.

