
Figure 3.
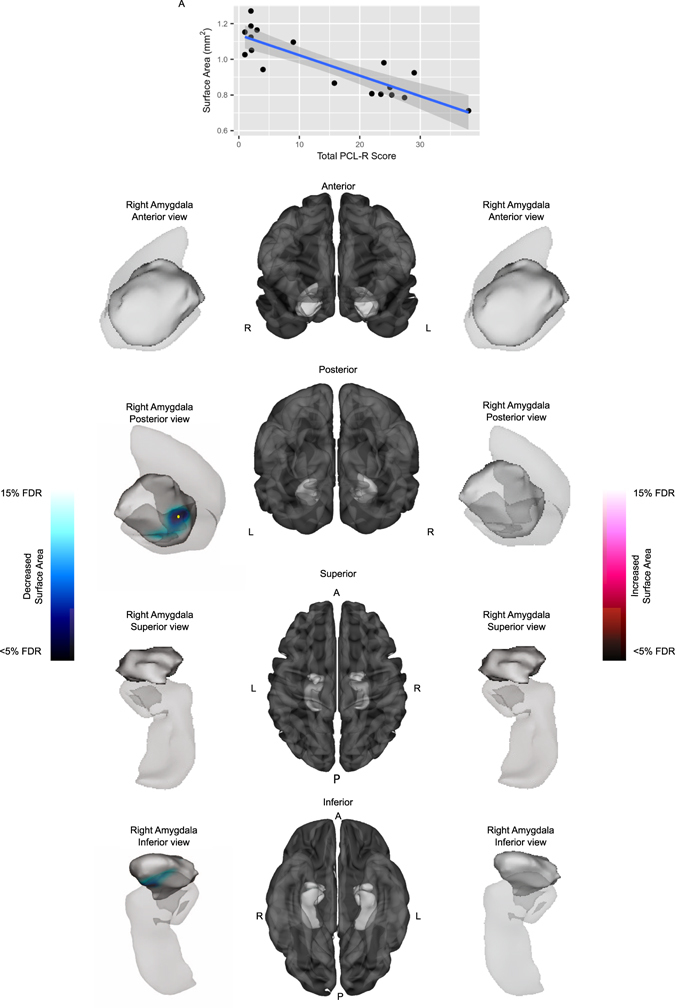
Relationship between PCL-R scores and amygdala surface area among individuals with the MAOA-L genotype. Anterior, posterior, superior, and inferior views of the amygdala and hippocampus (provided for context) are shown in the left and right panels, with a significant negative correlation shown on the left. Cortical representations in the center panel are provided for further context. Plot (A) displays the surface area measurements at a peak vertex denoted by the yellow markers. PCL-R score showed a negative correlation with surface area in the right BLA nucleus of the amygdala, (F(1, 13) = 6.55, 15% FDR) (posterior, inferior views, Plot (A)).