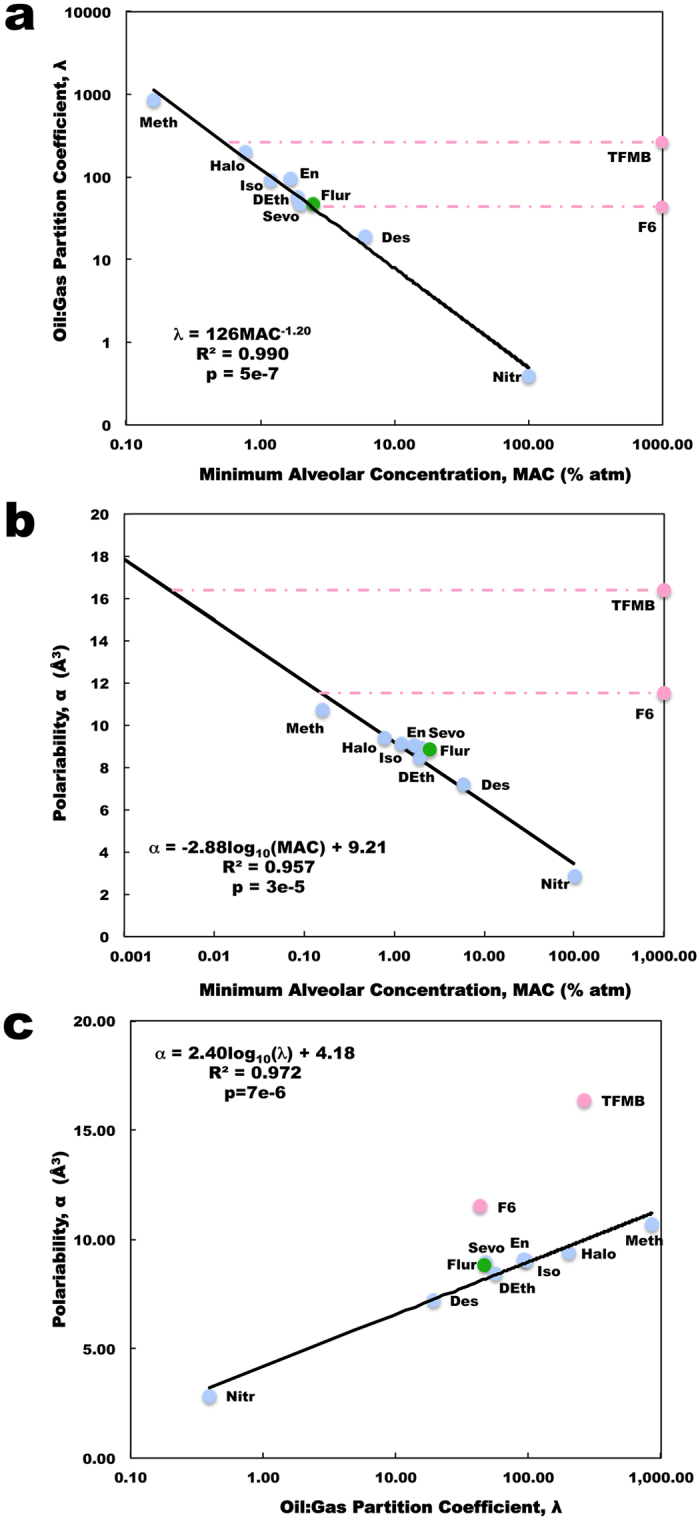
Figure 2.

Correlation of anesthetic properties with anesthetic potency. (a) Meyer-Overton correlation of oil:gas partition coefficient versus MAC (Blue points – anesthetics; Red points – non-anesthetics; Green points – anesthetic/convulsant; Red line – difference between non-anesthetic predicted and estimated (~1000% atm) MAC). (b) Correlation of polarizability versus MAC, with MAC for non-anesthetics determined from the Meyer-Overton correlation. (c) Correlation of polarizability versus solubility shows a difference in the relation between these properties for non-anesthetics and anesthetics. Trend lines and equations based on anesthetics alone, without the contributions from the non-anesthetics and anesthetic/convulsant.
