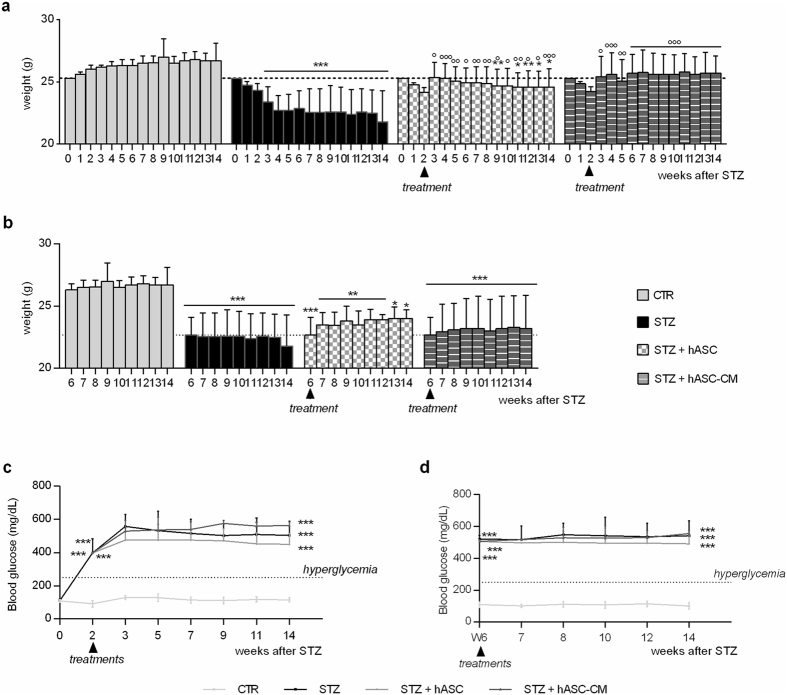
Figure 6.
Effect of hASC and hASC-CM on body weight and blood glucose levels in STZ mice. (a,b) Body weight of STZ mice treated with hASC or hASC-CM 2 weeks (a) and 6 weeks (b) after STZ. (c,d) Blood glucose levels of STZ mice treated with hASC or hASC-CM 2 weeks (c) and 6 weeks (d) after STZ. Data are means ± SD of 6/8 animals. Two-way ANOVA was used for statistical evaluation, followed by Bonferroni’s test for multiple comparisons. *p < 0.05, **p < 0.01, ***p < 0.001 vs CTR; °p < 0.05, °°p < 0.01, °°°p < 0.001 vs STZ.

