
Figure 6.
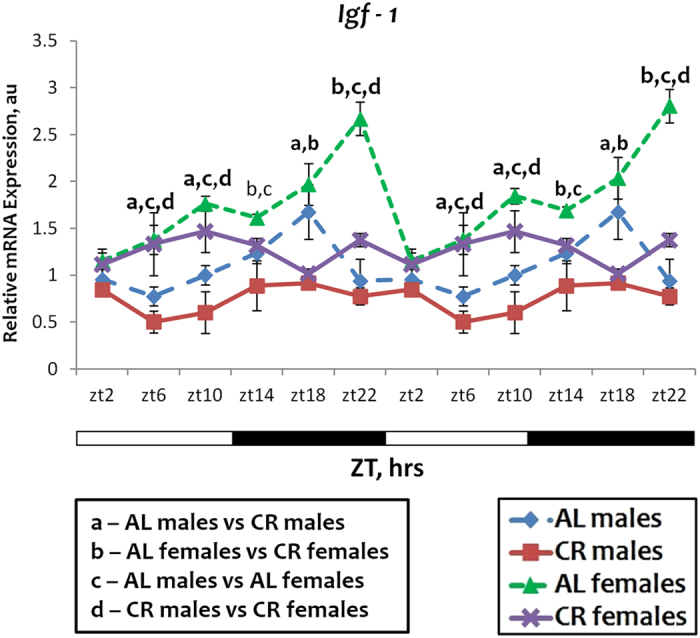
Sexual dimorphism in Igf-1 mRNA expression. The daily rhythms in expression of mRNA for Igf-1 in the liver: blue diamonds and dashed lines – AL male mice; red squares and solid lines – CR male mice, green triangles and dashed lines – AL female mice; purple x and solid lines – CR female mice. For all panels graphs are double plotted. Light is on at ZT0 and off at ZT12. a, b, c, d – statistically significant difference (p < 0.05) between indicated groups. Open bars represent light and black bars represent dark phase of the day. Food for CR group was provided at ZT14. At every time of the day 3 mice of each sex were used for each diet.