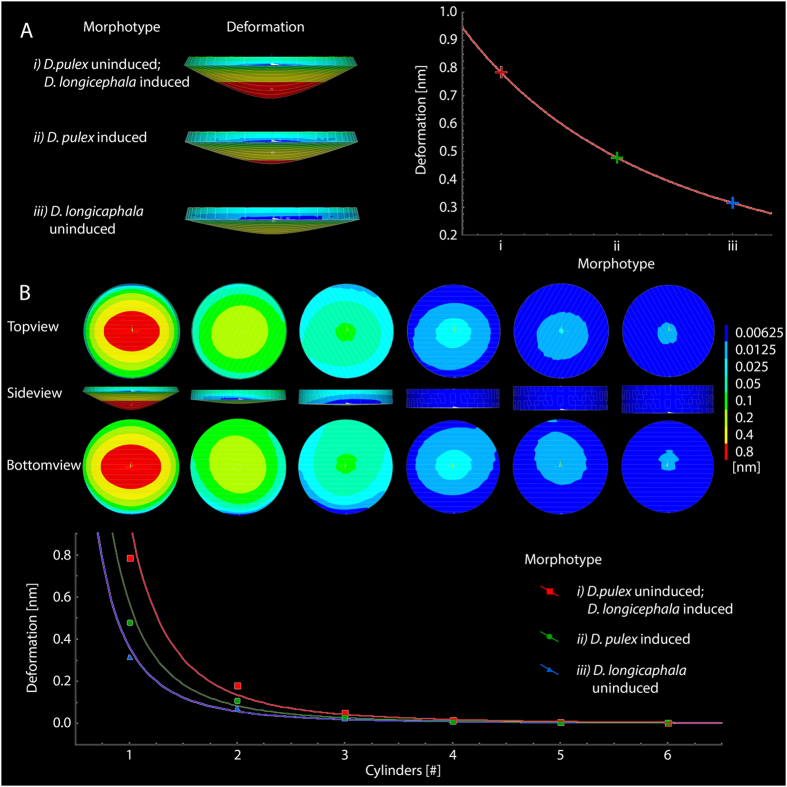
Figure 2.
FEA for the different morphotypes’ procuticle. (A) Simulated deformation of single cylinders used for model-creation of the different morphotypes (Side view); simulated deformation is visually amplified (factor 27). The graph shows the deformation of the single cylinders for the different morphotypes. Curve of best fit: f(x) = 93764x−2.708 (R2 = 1) (B) Simulated deformation of six calculated models with increasing thickness (one to six cylinders), representing morphotype i; simulated deformation is visually amplified (factor 27). The graph shows simulations of maximum deformation at the model’s bottom for all morphotypes. Curves of best fit: i: f(x) = 0.9679x−2.822 (R2 = 0.9887); ii: f(x) = 0.5703x−2.745 (R2 = 0.9907); iii: f(x) = 0.3621x−2.641 (R2 = 0.993).

