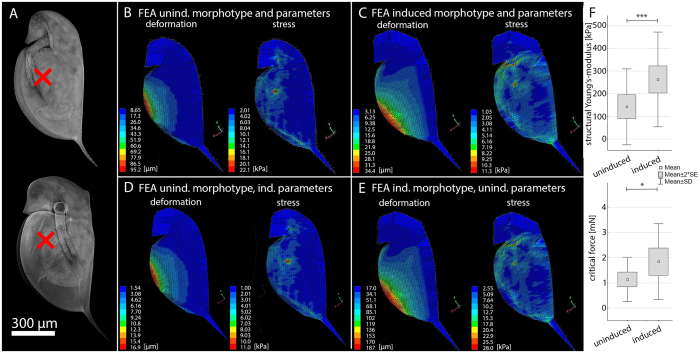
Figure 3.
FEA of D. pulex (A) CLSM projections of uninduced and induced form of D. pulex. The red x indicates the region of max lateral width, where the force of 1 mN was loaded onto the models. (B) Heat maps of deformation and stress distribution in an uninduced animal’s model. (C) Heat maps of deformation and stress distribution in an induced animal’s model. (D) Heat maps of deformation and stress distribution in an uninduced model with the material properties of an induced animal. (E) Heat maps of deformation and stress distribution in an induced model with material properties of an uninduced animal. (F) Empirical data of structural Young’s-modulus and critical force for uninduced and induced animals measured using a microindenter. (t-test, for structural Young’s-modulus measurement n (uninduced) = 41, n (induced) = 50; for critical force measurement n (uninduced) = 36, n (induced) = 31; Level of significance: *p ≤ 0.05; **p ≤ 0.01; ***p ≤ 0.005).

