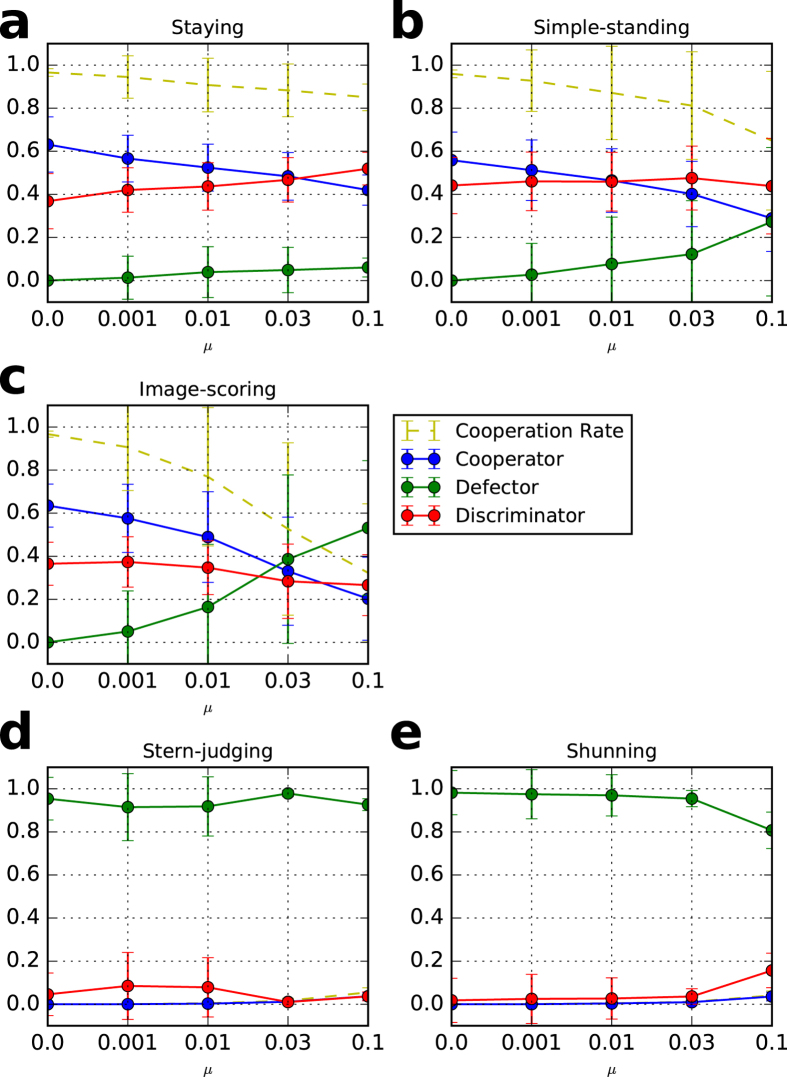
Figure 3.
Cooperation rates and strategies in a private monitoring system with different mutation rate, μ. Each dot reflects an average of 100 trials after 30 generations with five values of μ. (a) staying, (b) simple-standing, (c) image-scoring, (d) stern-judging, and (e) shunning. The error bars represent one standard deviation of the data. In the initial population, 10% are unconditional cooperators, 10% are unconditional defectors, and 80% are discriminators. The parameter values are N = 100, q = 0.01, b = 3, c = 1, e 1 = 0.03, e 2 = 0.03, T = 100,000, T s = 90,000, and β = 3.

