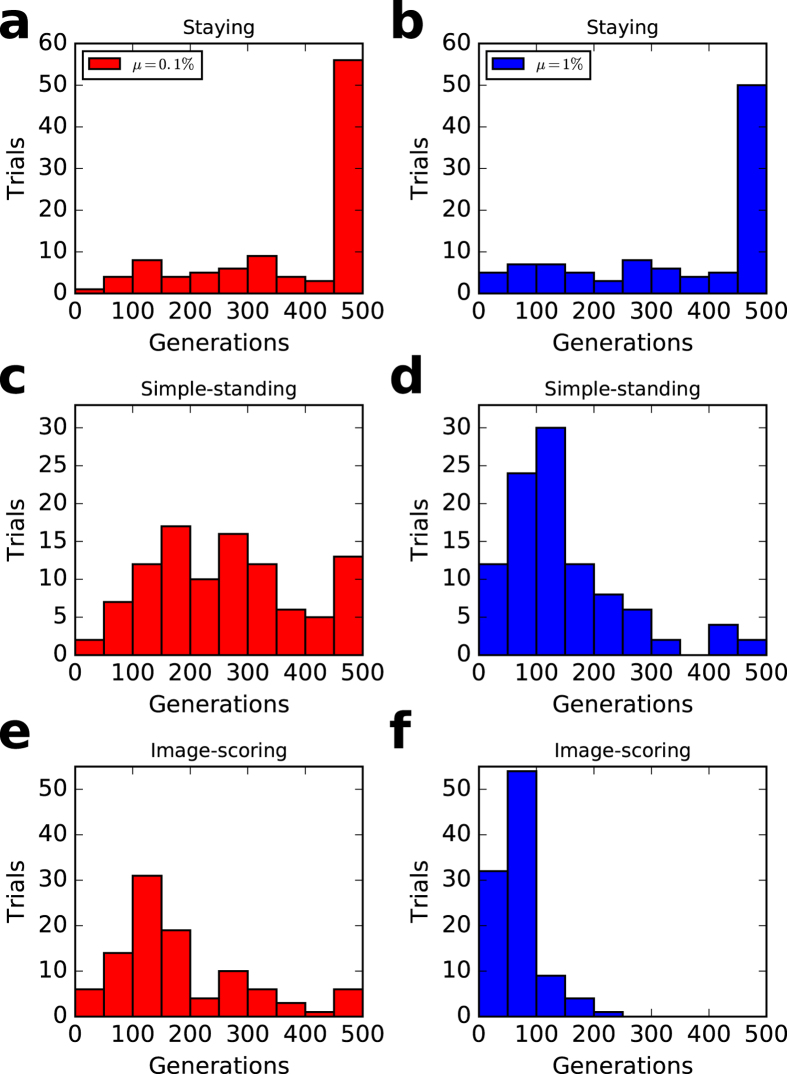
Figure 5.
Generation lengths for keeping cooperative regimes. (a and b) staying, (c and d) simple-standing, (e and f) image-scoring. (left) μ = 0.1% and (right) μ = 1%. In each trial, a run was broken off if either the cooperation rate was smaller than 0.2 or it reaches 500 generations. The histogram data are the generation lengths of 100 trials in each case. Each initial population consists of 100% discriminators. The parameter values are N = 100, q = 0.01, c = 1, e 1 = 0.03, e 2 = 0.03, T = 100,000, T s = 90,000, and β = 3.

