Fig. 2.
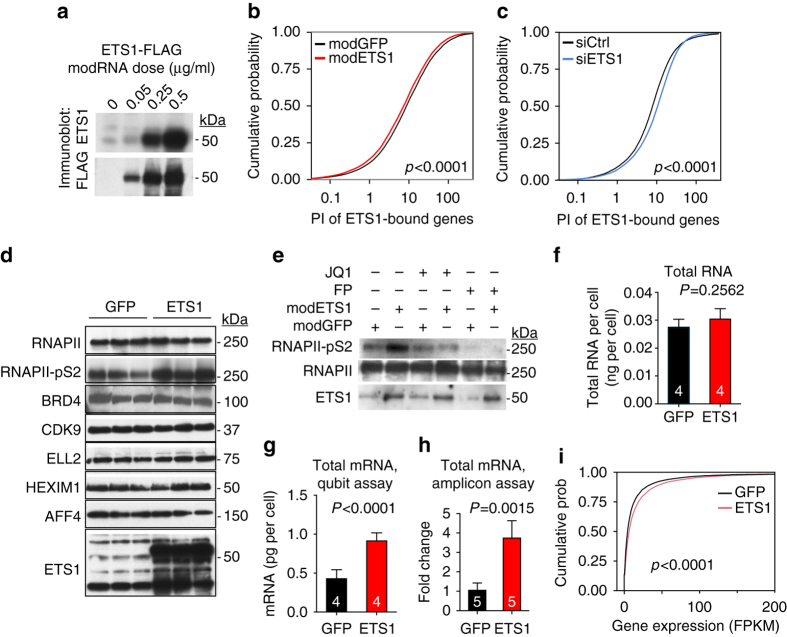
ETS1 stimulated RNAPII pause release. a Immunoblot of ETS1 expression in HUVEC cells 12 h after transfection by the indicated dose of ETS1 modRNA. b ETS1 overexpression reduced RNAPII pausing at ETS1-bound promoters. HUVEC cells were treated with ETS1 or GFP modRNA. Pausing index (PI) of ETS1-bound genes, a measure of a gene’s RNAPII paused at its promoter, was calculated from RNAPII ChIP-seq performed 12 h after transfection. ETS1 shifted the distribution of ETS1-bound genes to lower PI in treatment compared to control. c ETS1 knockdown increased RNAPII pausing at ETS1-bound promoters. Experiment as in b, except that cells were treated with control or ETS1 siRNAs. d ETS1 overexpression using modRNA increased actively elongating RNAPII (RNAPII-pS2) but not total RNAPII. HUVEC cells treated with GFP or ETS1 modRNA were analyzed by immunoblot at 12 h. e ETS1 overexpression increased actively elongating RNAPII through BRD4 and P-TEFb. ETS1 modRNA-induced increase of RNAPII-pS2 was blocked by BRD4 inhibitor JQ1 or P-TEFb inhibitor flavopiridole (FP). f–i ETS1 overexpression broadly increased mRNA expression. Total RNA f or mRNA g content per cell were measured by Qubit assay. Alternatively, mRNA was converted to RNA-seq libraries, using external spike-in RNA for normalization to cell number. Relative RNA-seq library yield per cell was measured by quantitative RTPCR. Cumulative distribution plot of RNA abundance per cell. Cumulative distribution plot of gene expression i showed that that ETS1 modRNA broadly increased gene expression. P-values were calculated by Student’s t-test (f–h) or by Kolmogorov–Smirnov test b, c, i. Bar graphs show mean ± s.d

