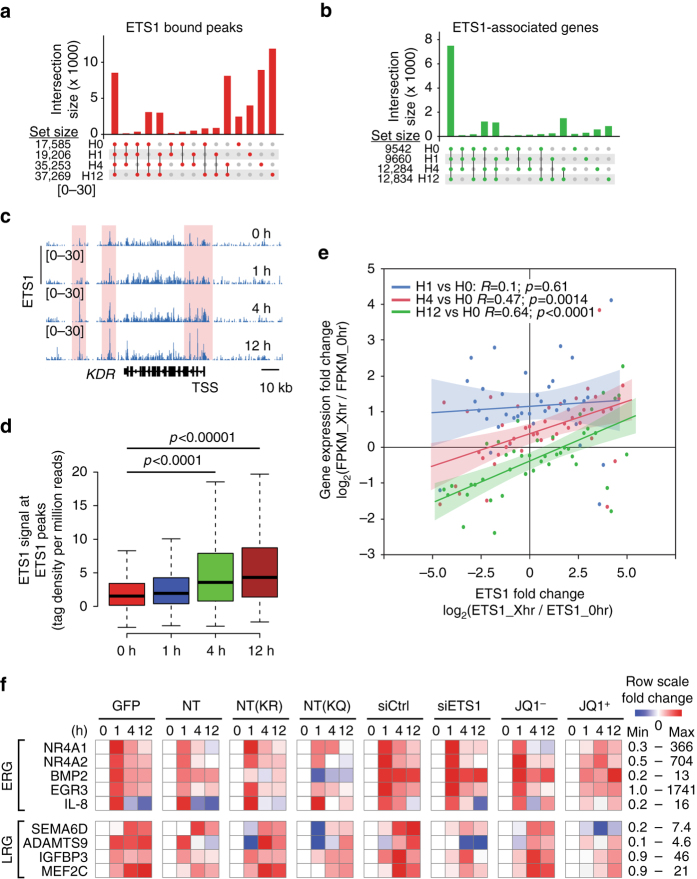
Fig. 5.
ETS1 amplified VEGF downstream transcription. a, b UpSet plots45 showing the overlap of ETS1-bound peaks (a) or ETS1-associated genes (b) between the four time points (0, 1, 4, 12 h). The bar represents the number of peaks shared by the time points indicated by the colored dots and not by the time points indicated by the gray dots. Most ETS1 peaks were not shared between time points, but most ETS1-associated genes were shared. c VEGF stimulated ETS1 chromatin occupancy. Genome browser view of ETS1 occupancy at the KDR locus at the indicated times of VEGF stimulation. Pink highlights regions with greater VEGF occupancy over the time course. d Genome-wide gain of ETS1 signal at ETS1-bound regions during VEGF stimulation time course. ETS1 binding increased genome-wide at 4 and 12 h. Mann–Whitney U-test. Dark line and boxes represent the median and 25th and 75th percentiles. The whiskers represent median ± 1.5 times the interquartile range. e. VEGF-induced changes in gene expression correlated to changes in ETS1 promoter occupancy. Analysis was limited to expressed genes with ETS1 promoter occupancy. Expression and ETS1 signal at the indicated time point of VEGF treatment are expressed as fold change compared to hour 0. Each point was calculated by grouping genes with similar ETS1 occupancy change. Correlation and p-values were plotted using a linear regression model. f VEGF-induced gene activation requires ETS1–BRD4 interaction. HUVEC cells were transduced with lentivirus expressing the indicated proteins, transfected with siRNA, or treated with small molecule JQ1. Gene expression after the indicated number of hours of VEGF stimulation was measured by qRT-PCR and displayed as a heat map. Log10 fold-change compared to time 0 was row scaled. Linear minimum and maximum fold-change values for each row are listed on the right

