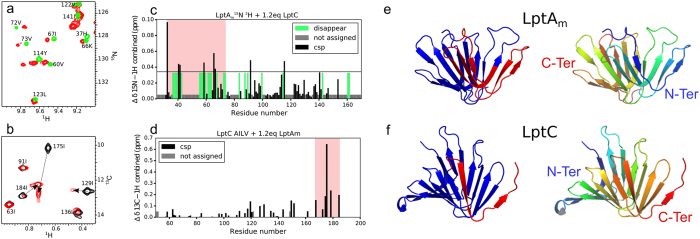
Figure 4.
LptC-LptAm interaction by NMR spectroscopy. (a) [1H, 15N]-correlation spectrum of [2H, 15N]-labeled LptAm in absence (green) and presence (red) of 1.2 molar equivalent of [1H, 14N]-LptC. (b) [1H, 13C]-correlation spectrum of LptC specifically 13C labeled and protonated on AβIδ1Lδ1Vγ1 methyl groups in absence (black) and presence (red) of 1.2 equivalent [1H, 12C]-LptAm. (c) and (d) Chemical shift perturbation induced upon complex formation on LptAm and LptC proteins, respectively. Two regions of LptAm and LptC are perturbed upon complex formation (light red boxes), the N-terminus and C-terminus of the proteins, respectively. These regions are represented in red on the ribbon structures of (e) LptAm (residues 29–159) and (f) LptC (residues 56–185). The right panels in (e) and (f) show LtpAm and LptC in the same orientation as in the left panel with a blue-to-red gradient from N- to C-termini of the proteins.

