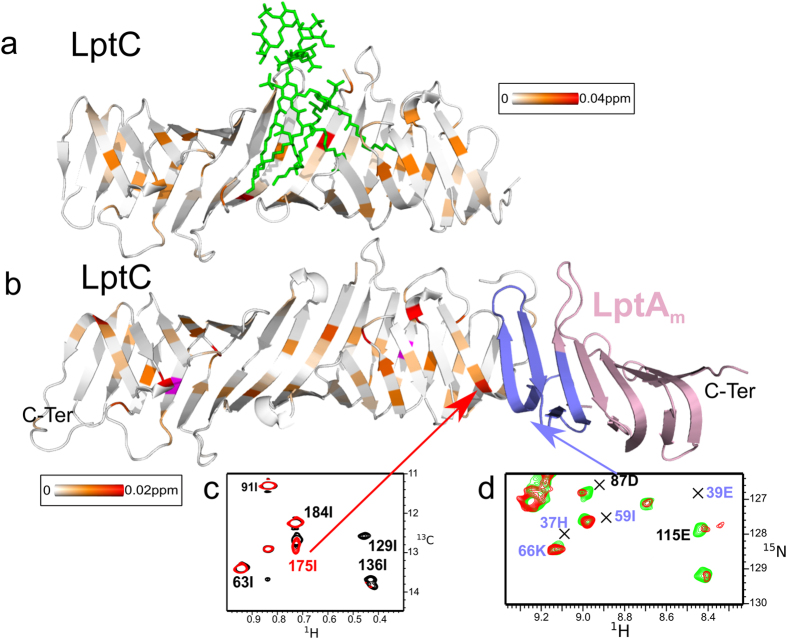
Figure 7.
Interaction of LptC dimer and of LptC-LptAm complex with the E. coli lipopolysaccharide. Representation of methyl 1H and 13C combined CSP induced by LPS (0.8 mg/ml) in the isolated LptC dimer (a) or in the LptC-LptAm complex (b). Gradient colors used for the display of the CSP values are shown. Residue in magenta disappeared upon LPS addition. For clarity only one LptAm molecule of the LptC-LptAm complex is represented. Residues of LptAm colored in blue correspond to the perturbed area upon LptC interaction (as in red on Fig. 4e). (c) [1H, 13C]-correlation spectrum of methyl-labeled and perdeuterated LptC in complex with unlabeled LptAm with (red) or without (black) 2.1 mg/ml of LPS. (d) [1H, 15N]-correlation spectrum of [2H, 15N]-labeled LptAm in complex with unlabeled LptC without (green) or with (red) 2.1 mg/ml of LPS. The resonances assigned in the free form of LptAm are indicated by a cross.

