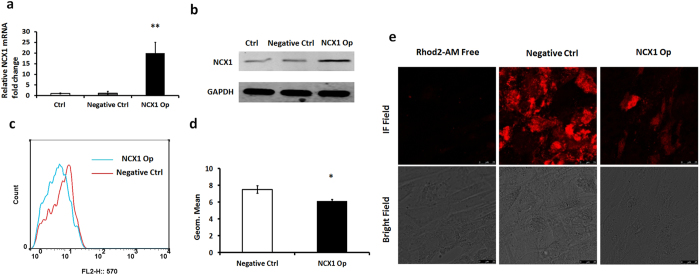
Figure 2.
Flow cytometry assay showing apparent reduction in cytosolic calcium concentration in human DASMCs transfected with NCX1-cDNA. (a) Compared with the control and negative control groups, DASMCs transfected with NCX1-cDNA express higher levels of NCX1 mRNA. (b) Cropped blots showed that compared with the control and negative control groups, DASMCs transfected with NCX1-cDNA express higher levels of NCX1 protein. (c) Negative control (red) and siARHGAP26 (blue) groups are shown (n = 3). (d) Quantification of mean calcium fluorescence intensity showed an apparent reduction in cytosolic calcium concentration in DASMCs transfected with NCX1-cDNA. (e) Calcium imaging showed that after overexpression of NCX1 the fluorescence in the DASMCs which represent for the cytosolic calcium concentration was reduced compared to the negative control group. The scale bar is 25 μm. The error bars indicate means ± SD. *P < 0.05, **P < 0.01.

