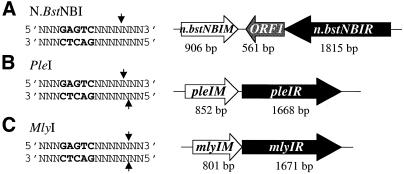
Figure 1.
Recognition sequences and gene organizations of N.BstNBI, PleI and MlyI R–M systems. The recognition sequence, GAGTC, is highlighted in bold, and cleavage sites are indicated by small arrows. Open boxes represent the ORFs and their directions are indicated by arrows. Endonuclease genes are shown in black and methyltransferase genes are shown in white. The size of each gene is indicated under the gene.

