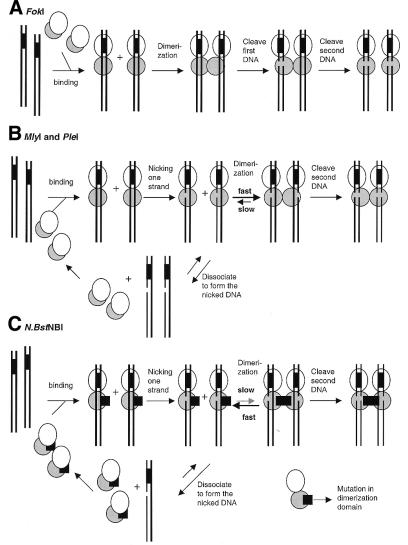
Figure 7.
Schematic diagram showing the hypothesized DNA cleavage models of Type IIs restriction endonucleases FokI (A), MlyI and PleI (B) and the N.BstNBI nicking enzyme (C). Ellipses indicate the DNA binding domain and the gray circles represent DNA cleavage domains of the Type IIs restriction endonucleases. Double strand DNA is shown as two solid lines and the GAGTC recognition sequence is indicated by the black-filled box between the two lines.

