
Figure 5.
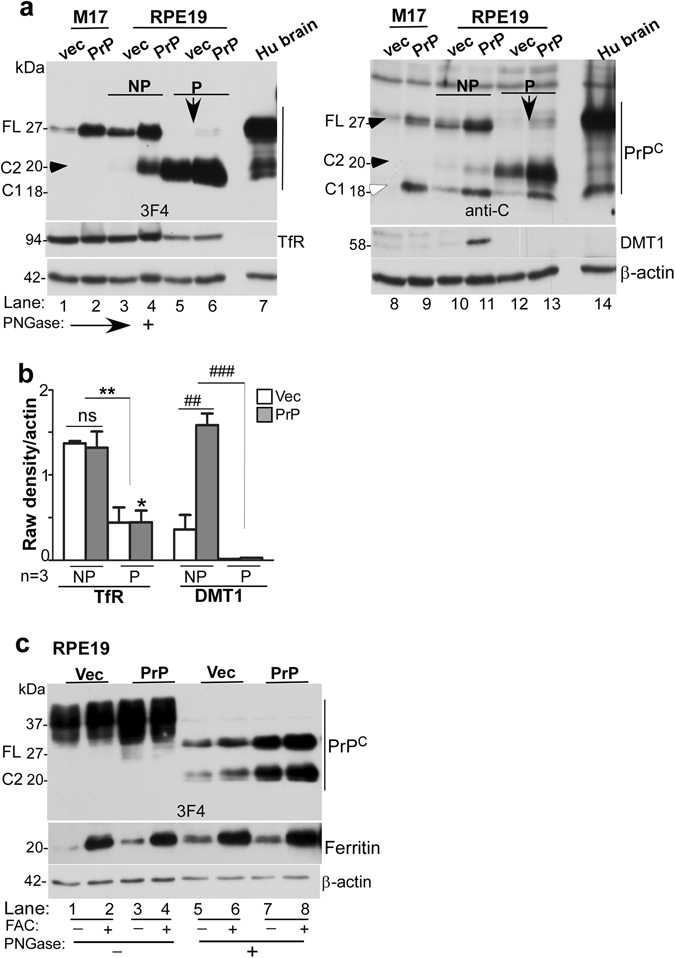
β-cleavage of PrPC modulates intracellular iron and is unique to polarized RPE cells. (a) Deglycosylated lysates from vector and PrPC-expressing M17 and RPE cells and human brain were probed with PrP-specific antibodies 3F4 and anti-C to estimate the relative abundance of full-length (FL), α-cleaved (C1), and β-cleaved (C2) forms in each sample. Probing with 3F4 that reacts with FL and C2 (Fig. 4a) reveals undetectable levels of C2 in M17 cells even after over-expressing PrPC (lanes 1 & 2). RPE cells, on the other hand, show significantly more C2 in non-polarized cells (lanes 3 & 4), and almost complete cleavage of FL to the C2 form following polarization (lanes 5 & 6). The brain sample shows minimal levels of C2 as in M17 cells (lane 7). Probing with anti-C antibody that reacts with FL, C1, and C2 (Fig. 4a) shows FL and C1 in M17 and brain lysates (lanes 8, 9, 14), and mainly C2 in RPE samples (lanes 10–13). Re-probing for TfR shows down-regulation following polarization of RPE cells (lanes 3 & 4 vs. 5 & 6). Re-probing for DMT-1, on the other hand, shows up-regulation in PrPC-expressing non-polarized RPE cells (lanes 10 & 11), and down-regulation following polarization (lanes 10 & 11 vs. 12 & 13). (b) Densitometric analysis of protein bands after normalization with β-actin shows downregulation of TfR following polarization of RPE cells to less than half, and upregulation of DMT-1 in PrPC-expressing non-polarized cells by ~3-fold. DMT-1 expression is minimal in polarized RPE cells. Values are mean ± SEM of the indicated n. ns, not significant, *p < 0.05, **p < 0.01, ##p < 0.01, ###p < 0.001. (c) Exposure of non-polarized RPE cells to FAC increases the ratio of C2 vs. FL that is more evident following deglycosylation (lanes 5 & 7 vs. 6 & 8; d). Re-probing for ferritin shows a significant increase following FAC treatment as expected (lanes 2, 4, 6, 8).