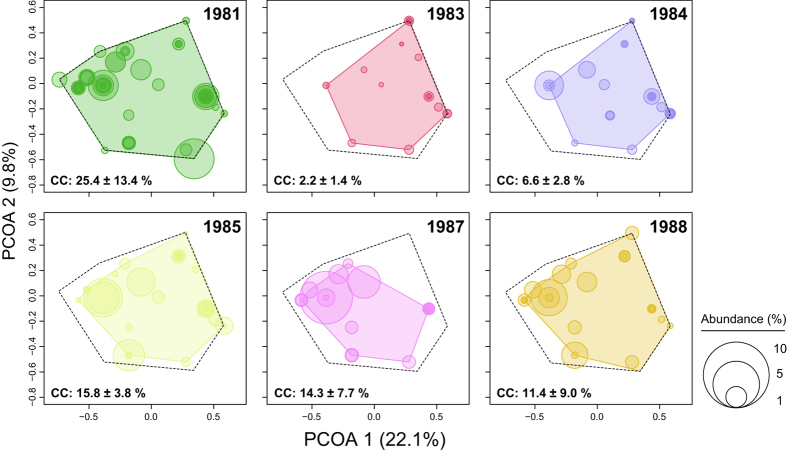
Figure 2.
Evolution of morpho-functional space from 1981 to 1988. Circles represent species occurrence in the coral assemblage and are proportional to species relative abundance (%). Colored polygons characterize functional space filled by species (i.e., Functional Richness, FRic). Pre-bleaching FRic is symbolized by a dash line and the change in FRic displayed as the difference from the convex surface of the FRic for the following years. Coral Cover (CC) is given as mean ± standard error.

