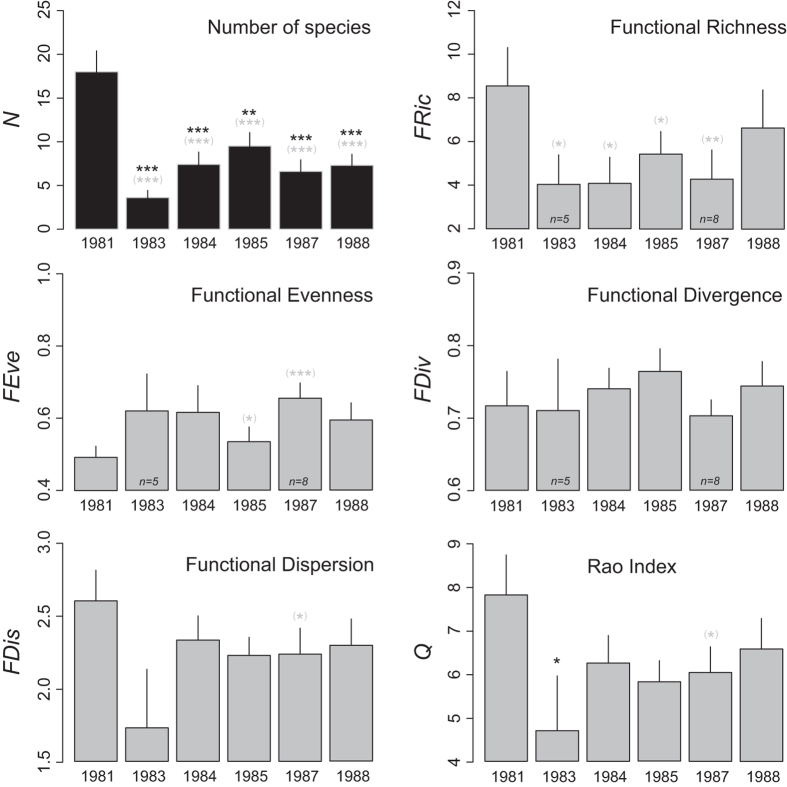
Figure 4.
Evolution of the average species richness and functional diversity from 1981 to 1988. Histograms show the number of species (N), Functional Richness (FRic), Functional Evenness (FEve), Functional Divergence (FDiv), Functional Dispersion (FDis), and Rao’s quadratic entropy (Q) indices. Error bars are standard errors with n = 10 except where indicated in the bars. Levels of significance of the t-tests are symbolized by black asterisks: ***<0.001, ** < 0.01, *<0.05. Grey asterisks in parentheses indicate levels of significance from paired t-tests.

