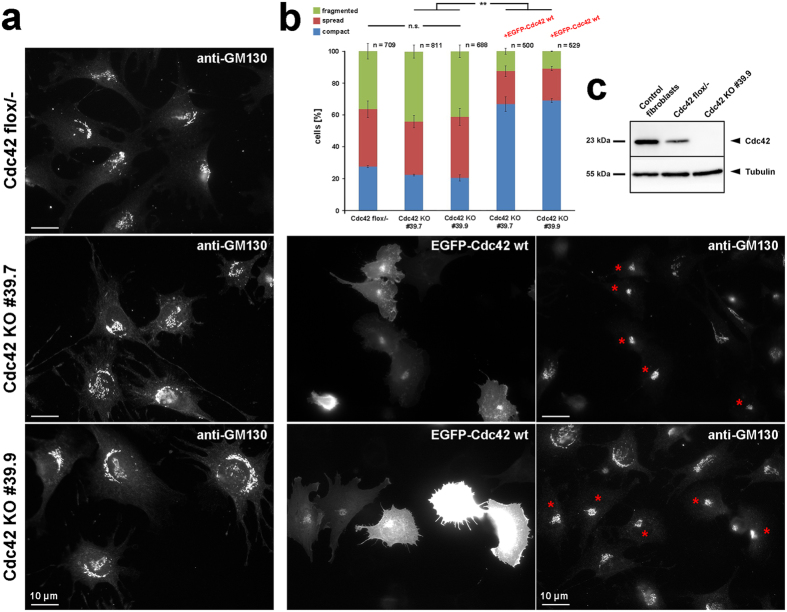
Figure 4.
Cdc42 expression levels affect Golgi morphology. (a) Representative examples of Cdc42 flox/- fibroblastoid cells and two Cdc42 KO clones stained for the cis-Golgi compartment using GM130-reactive antibody (left column). Moreover, both KO clones were transfected with EGFP-tagged wildtype Cdc42 (middle panel), with representative transfected cells displaying a compact Golgi as judged by GM130 staining highlighted by red asterisks in panels on the right. (b) Bar graph displaying percentages of cells harboring Golgi morphologies as classified in Fig. 3a (compact, spread, fragmented). Columns 4 and 5 show classification of observed Golgi morphologies of both Cdc42 KO clones transfected with EGFP-tagged, wildtype Cdc42; n gives number of cells analyzed, error bars are ± sem from three independent experiments. Differences in cell numbers exhibiting a dispersed Golgi morphology were not statistically significant when comparing flox/- control cells with each of the KO clones. However, differences were statistically significant for each KO clone compared to the same cells expressing EGFP-tagged, wildtype Cdc42 (t-test; p = 0.002). (c) Western Blotting of Cdc42 demonstrating complete absence in KO cell populations exemplified by KO clone #39.9 and reduced expression of this protein in Cdc42 flox/- cells compared to control fibroblasts. Tubulin was used as loading control.

