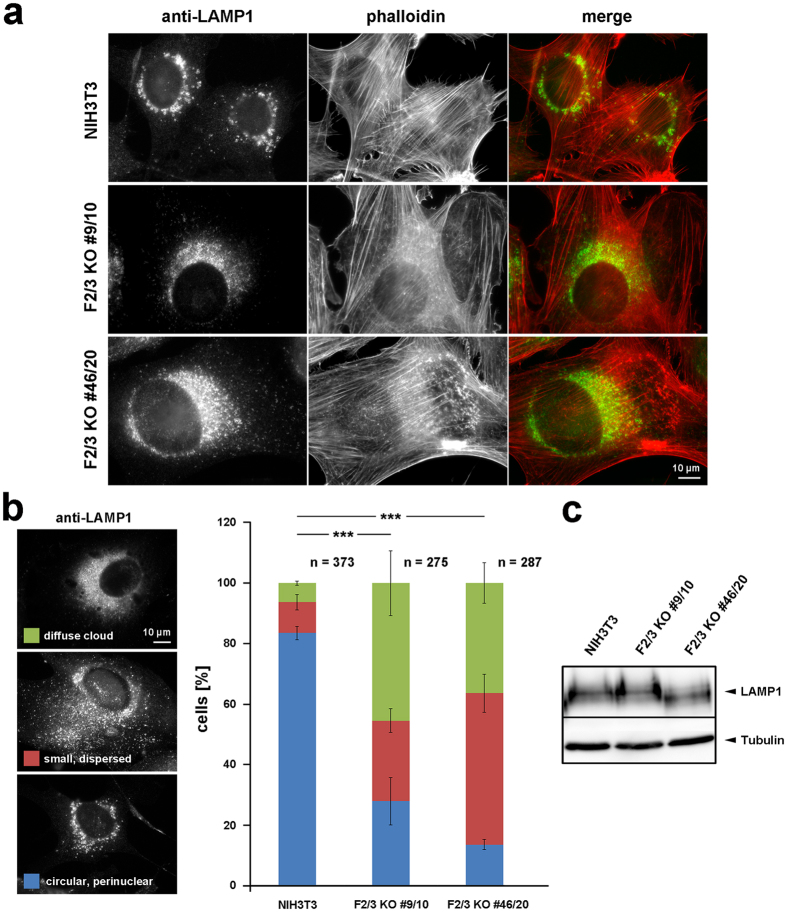
Figure 6.
: FMNL2/3 KO causes malformation of lysosomes. (a) Anti-LAMP1 staining visualizing lysosomal compartments, with co-staining by phalloidin to reveal overall cell morphology; merges on the right, as indicated (actin filaments in red, lysosomes green). Note the prominent difference in appearance of lysosomes in control NIH3T3 cells versus FMNL2/3 KO clones. (b) Cell images on the left: Representative examples for manual categorization of cellular lysosome morphologies, as indicated (“circular perinuclear”, most representative for lysosome appearance in NIH3T3 control fibroblasts, “small dispersed” as intermediate phenotype and “diffuse cloud” as most severe phenotype. Right panel: Bar chart illustrating results of manual categorization according to the color code depicted on the left, with stacked columns corresponding to arithmetic means and error bars to sem; n gives number of cells analyzed, statistical significance of differences was determined for parameter “diffuse cloud” (t-test). (c) Western blot illustrating comparable expression levels of LAMP1 in control versus FMNL2/3 KO cells. Tubulin validates equal loading.

