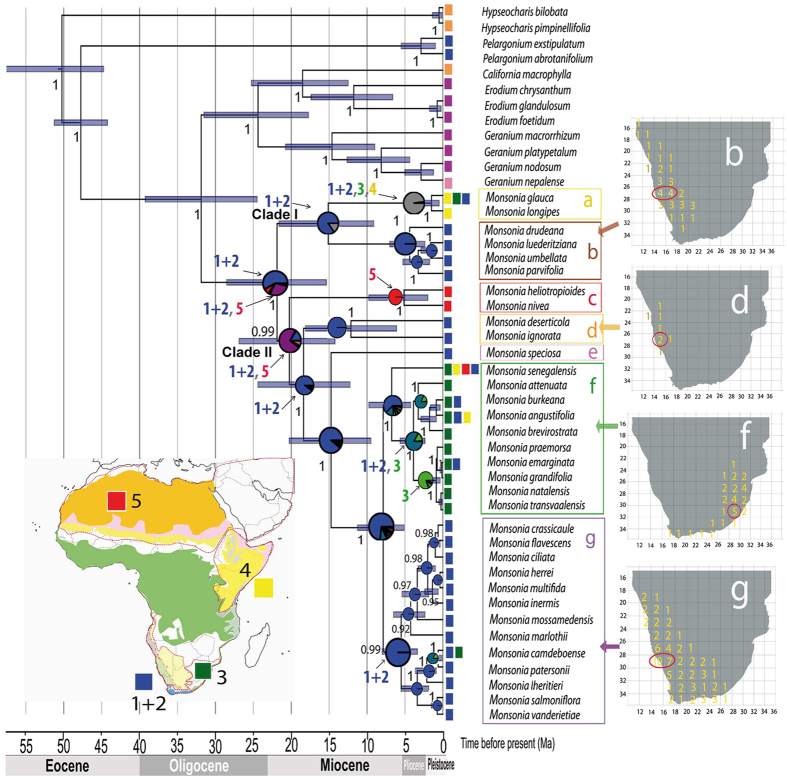
Figure 2.
Maximum clade credibility (MCC) tree from the BEAST analysis of plastid and nuclear markers with ancestrsal areas reconstructed using (DEC). Areas are: blue) Namib-Karoo plus the Cape (1 + 2); green) Natal-Drakensberg (3); yellow) Eastern Africa (4); red) Sahara, Arabia and W Asia (5); orange) America; purple) Eurasia. Maps on the right indicate the number of endemic species ascribed to each clade by grid cell of 2° of latitude × 2° longitude. The map with the vegetation zones is a simplification of the map in Fig. 1 generated with the software Adobe Illustrator CS4 (https://www.adobe.com). The maps on the right of the figure were also generated with the software Adobe Illustrator CS4 (https://www.adobe.com).

