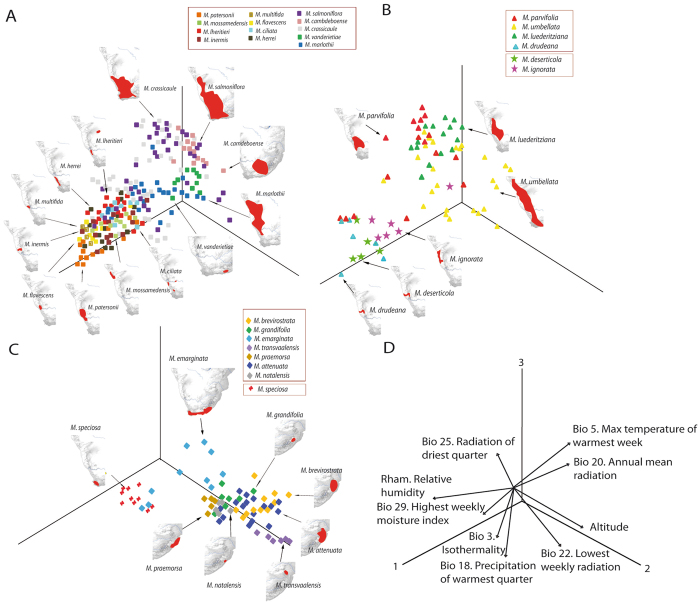
Figure 5.
Niche analyses showing the results of the PCA for the dataset of South African species excluding widespread species; each species labelled with a different symbol. The analysis was performed with nine variables which captured ca. 83% of the variance in the first three components (PC1: 33.5%, PC2: 30.3%, PC3: 16.6%). (A) Monsonia subg. Sarcocaulon (subclade g in Fig. 2). (B) Monsonia gr. umbellata (triangles) and M. gr. deserticola (stars) (subclades b and d in Fig. 2). (C) Monsonia gr. attenuata (diamonds) and M. speciosa (red crosses) (subclades e and f in Fig. 2). (D) Weight of the variables in the PCA. Maps obtained with the software ArcGIS version 10.3.

